 Global| Dec 01 2008
ISM Index the Lowest Since 1982 Recession; Pricing Power Evaporated
by:Tom Moeller
|in:Economy in Brief
Summary
The Institute for Supply Management (ISM) reported that its November Composite Index of Activity in the manufacturing sector came in at 36.2. The index fell 2.7 points from October and it was the fifth decline in as many months. The [...]
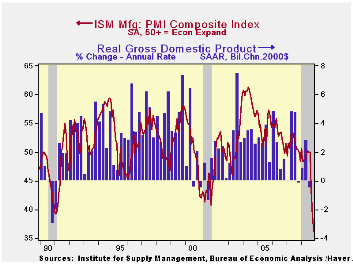
The Institute for Supply Management (ISM) reported that its November Composite Index of Activity in the manufacturing sector came in at 36.2. The index fell 2.7 points from October and it was the fifth decline in as many months. The figure was again the lowest level since the 1981-82 recession and was lower than expectations for a reading of 37.5. The break-even level for this diffusion index of factory sector activity is 50.
During the last twenty years there has been a 64% correlation between the level of the Composite Index and the three-month growth in factory sector industrial production.
It is appropriate to correlate the ISM index level with factory sector growth because the ISM index is a diffusion index. It measures growth by using all of the positive changes in activity added to one half of the zero change in activity measures.
Lower oil prices plunged the separate index of prices paid by
another 11.5 points. It fell to 25.5 after the 16.5 point October drop.
The latest was the lowest level since 1949. During
the last twenty years there has been a 79% correlation between the
price index and the three-month change in the PPI for intermediate
goods.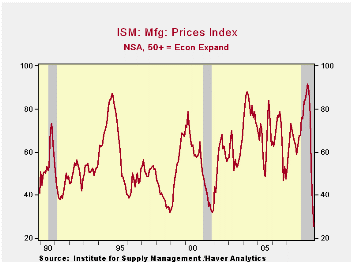
During the last three months the ISM index composite index fell by nearly fourteen points. A decline of that magnitude was exceeded only by the drop during the short "credit crunch" recession of 1980. Following that decline, the index bounced back smartly only then to fall again during the sharp recession of 1981-82. How severe was that economic downturn? During all of 1982 the average level of the ISM (then called the Nat'l Association of Purchasing Management) index was 38.5 versus an average 52.5 during 1979. The index level signaled a 5.4% decline in factory sector industrial production during 1982 as reported by the Federal Reserve Board.
The new orders index during November again fell sharply to 27.9. The index is down over twenty points during the last three months, again the sharpest decline since 1980. Only 12% of survey participants reported higher orders while 59% reported lower orders. The export order index continued to reflect economic weakness outside of the U.S., though it was unchanged at 41.0, the lowest level in this index's short twenty year history. During the last ten years there has been a 53% correlation between the index and the q/q change in real exports of goods in the GDP accounts.
The production sub-series reflected the weakness in new orders
and it fell 2.6 points to 31.5, off 20.6 points during the last three
months. Following was the employment index which logged a slight m/m
decline to 34.2, the lowest reading since early 1991. During the last
twenty years there has been a 67% correlation between the level of the
ISM employment index and the three-month growth in factory sector
employment.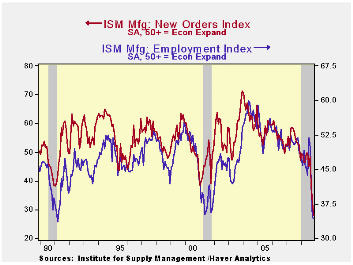
The shedding of inventories continues. The index level of 39.1 was down from 44.3 in October and was at its lowest since the recession of 2001. The index gauging the speed of supplier deliveries fell further (indicating faster delivery) and order backlogs fell to the lowest level in the series' history.
Too big to fail: the way forward from the Federal Reserve Bank of Minneapolis can be found here.
| ISM Mfg | November | October | November '07 | 2007 | 2006 | 2005 |
|---|---|---|---|---|---|---|
| Composite Index | 36.2 | 38.9 | 50.0 | 51.1 | 53.1 | 54.4 |
| New Orders Index | 27.9 | 32.2 | 52.5 | 54.3 | 55.4 | 57.4 |
| Employment Index | 34.2 | 34.6 | 48.4 | 50.5 | 51.7 | 53.6 |
| Prices Paid Index (NSA) | 25.5 | 37.0 | 67.5 | 64.6 | 65.0 | 66.4 |
by Tom Moeller December 1, 2008
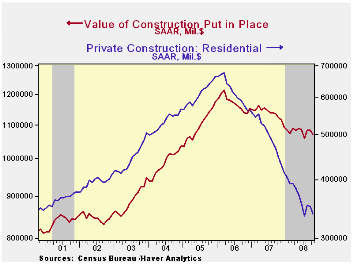
The October value of construction put in place fell 1.2% during October. The decline followed a slight September downtick which was revised to be shallower than the initial report. Consensus expectations had been for a 0.9%. Construction activity continued to decline 4.6% y/y.
Residential building activity again led the latest monthly decline with a 3.5% drop and activity remained off by a quarter from last year. Single-family construction activity fell 4.6%, off by two-thirds from its peak in early-2006. Building activity on multi-family units slipped 0.3% (-1.4 y/y), off roughly 20% from the early 2007 peak. Spending on improvements fell 3.2% m/m but still was up slightly versus last year.
During the last twenty years there has been an 84% correlation
between the q/q change in the value of residential building and its
contribution to growth in real GDP.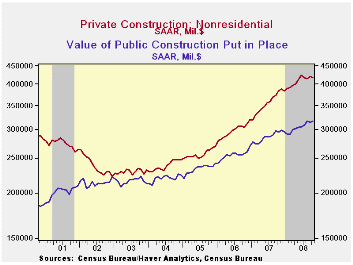
The value of nonresidential building activity slipped 0.7% after a little-revised 1.1% September increase. Spending on office construction did rise 1.1% but the y/y gain of 4.4% is much reduced from the near 20% growth of the prior two years. Building in the multi-retail sector rose 7.5% but the y/y decline of 7.2% compares to a 17% gain last year. Spending on health care facilities reversed a September increase and fell 1.1% (+3.9% y/y).
Public construction reversed a September decline and rose 0.7%. The value of spending on educational facilities rose a firm 1.2% (10.1% y/y) but the value of construction spending on highways & streets fell for the second month by 0.9% (+6.3% y/y). The value of construction on highways & streets is roughly one-third of the value of total public construction spending.
The more detailed categories of construction represent the Census Bureau’s reclassification of construction activity into end-use groups. Finer detail is available for many of the categories; for instance, commercial construction is shown for automotive sales and parking facilities, drugstores, building supply stores, and both commercial warehouses and mini-storage facilities. Note that start dates vary for some seasonally adjusted line items in 2000 and 2002, and that constant-dollar data are no longer computed.
| Construction (%) | October | September | Y/Y | 2007 | 2006 | 2005 |
|---|---|---|---|---|---|---|
| Total | -1.2 | -0.0 | -4.6 | -2.7 | 6.3 | 11.2 |
| Private | -2.0 | 0.4 | -8.8 | -6.9 | 5.5 | 12.7 |
| Residential | -3.5 | -0.5 | -24.2 | -19.8 | 1.0 | 14.9 |
| Nonresidential | -0.7 | 1.1 | 9.1 | 19.6 | 16.2 | 7.8 |
| Public | 0.7 | -0.9 | 7.4 | 12.3 | 9.3 | 6.2 |
by Robert Brusca December 01, 2008
No hunt for this red October…
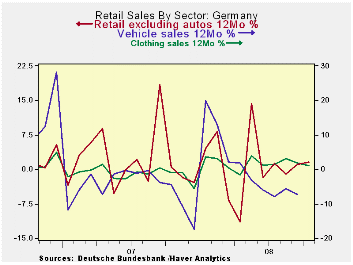
German retail sales were unexpectedly weak in October. The
‘unexpectedly’ part is just as important as the ’weak’ part since
Germans have been deluding themselves with a view of how this crisis is
going to pass them by. Chancellor Merkel is disdainful of what she
regards as competition over who can launch the largest stimulus plan
and has in contrast to much of the rest of the world continued to sit
on the sidelines and watch as Germany’s economy unravels. Retail sales
in Germany are steadily and progressively deteriorating. Real ex auto
sales are down at a 3.9% annual pace over three months compared to a
-2.2% pace over six months and -1.4% over 12-months. What is the
surprise there? Why should that sequence of growth rates, that is so
very well-behaved, be called ‘unexpected?’ Sales had risen by a strong
2.1% in August and after a rise of 0.3% in July. But September and
October sales now tell a different story and one that is consistent
with the world surrounding the German economy as well. The progression
of growth rates shows the August ‘burst of strength’ to have been a
false signal. Real and nominal series tell pretty clear stories if
anyone is watching. Now Germany’s auto sector is getting hit harder as
short hours are being planned.
| German Real and Nominal Retail Sales | ||||||||
|---|---|---|---|---|---|---|---|---|
| Nominal | Oct-08 | Sep-08 | Aug-08 | 3-mo | 6-mo | 12-mo | Yr Ago | QTR Saar |
| Retaill excl Auto | -1.7% | -1.1% | 2.1% | -3.0% | -0.2% | 1.1% | -1.0% | -10.1% |
| Food Beverage & Tobacco | -0.4% | -1.7% | 3.4% | 5.0% | 0.4% | 0.0% | 2.6% | -2.6% |
| Clothing & Footwear | -4.4% | 4.1% | -0.1% | -2.5% | 9.3% | 1.6% | 0.5% | -10.9% |
| Real | ||||||||
| Retail excl Auto | -1.6% | -1.0% | 1.6% | -3.9% | -2.2% | -1.4% | -2.4% | -9.9% |
by Robert Brusca December 01, 2008
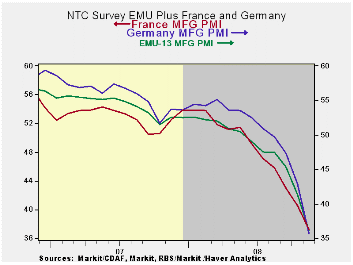
The NTC final indices are now out and are weaker than their
FLASH counterparts were. The percentile column on the far right seems
due for an ‘out of order’ sign except that it is not out of order. The
overall index as well as the country components and the UK index are
all at lifetime lows- even for Germany an index that goes back to 1996
and for the UK that goes back to 1992. The drop off in MFG in Europe
has been very sharp and the authorities have been caught off guard.
They watched the troubles in the US unfold largely thinking that the
problems would not migrate over the ocean to such a great degree but of
course they have.
Germany’s MFG index stood at 49.68 barely indicating any
contraction as recently as August, just three short months ago. At that
time the EMU index had slipped to 47.55. Over three months the EMU MFG
index has dropped by 11.97 points compared to a drop of 14.02 points
for Germany. Over six months the EMU index is lower by 15.02 points
compared to a drop of 17.91 for Germany. But over 12-months the EMU
drop at 17.22 is very similar to Germany’s drop of 18.08 points.
Spain’s index has dropped by 21.31 points over 12-months and the UK, an
EU member nation, has seen its MFG index drop by 20.23 points over that
period.
In short, Europe is sliding very fast. The US PMI dropped by
11.5 points in 12 months though October compared to a drop of 10.42
points for EMU. So the US unravel has been a bit faster than Europe’s
–at least through October. The US MFG report for November will be out
later today. It would have to fall to 28.32 in order for the US MFG PMI
(ISM) to have the same point drop as the EMU index over the last
12-months (though November). To do that it would have to drop to a
level of 21.7. For now it appears that Europe has caught up to or
surpassed the US in the race to show which region’s MFG sector is
declining the most rapidly.
A dubious distinction…
| NTC/Markit MFG Indices | |||||||
|---|---|---|---|---|---|---|---|
| Nov-08 | Oct-08 | Sep-08 | 3-Mo | 6-Mo | 12-Mo | Percentile | |
| Euro Area 13 | 35.58 | 41.10 | 44.97 | 40.55 | 44.29 | 48.07 | 0.0% |
| Germany | 35.66 | 42.88 | 47.36 | 41.97 | 46.51 | 50.31 | 0.0% |
| France | 37.28 | 40.59 | 42.97 | 40.28 | 43.82 | 48.25 | 0.0% |
| Italy | 34.95 | 39.67 | 44.42 | 39.68 | 43.06 | 46.35 | 0.0% |
| Spain | 29.42 | 34.60 | 38.32 | 34.11 | 37.43 | 42.16 | 0.0% |
| Austria | 38.26 | 43.44 | 46.01 | 42.57 | 45.28 | 48.69 | 0.0% |
| Greece | 42.25 | 48.14 | 50.81 | 47.07 | 49.85 | 51.37 | 0.0% |
| Ireland | 37.10 | 39.69 | 43.70 | 40.16 | 42.25 | 44.59 | 0.0% |
| Netherlands | 38.71 | 45.28 | 48.30 | 44.10 | 46.86 | 49.72 | 0.0% |
| EU | |||||||
| UK | 34.36 | 40.70 | 40.80 | 38.62 | 41.78 | 46.23 | 0.0% |
| percentile is over range since March 2000 | |||||||
by Louise Curley December 1, 2008
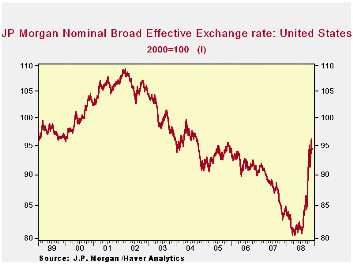
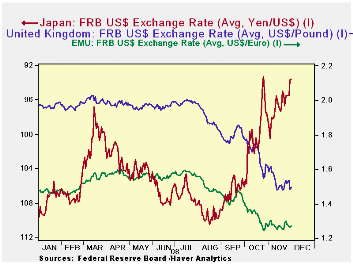
J.P. Morgan's broad effective exchange rate for the U. S. hasstaged a dramatic reversal in its long decline since 2001 by appreciating 17% from July 15 to last Friday. The first chart shows the daily values of this index over that past ten years.
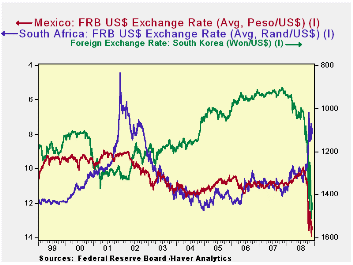
It is hard to find a country whose exchange rate has not depreciated against the U. S. dollar in the period from July 15 to November 28, 2008.The one significant exception is Japan where the currency has appreciated by almost 10% against the dollar. Both the Euro and the British pound have experienced depreciations of 20% and 23% respectively. These currencies are shown in the second chart.
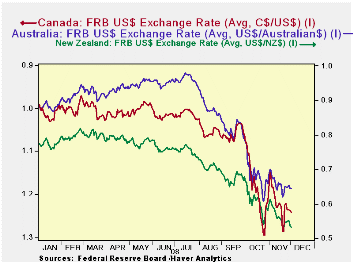
The Canadian dollar has seen a 22% decline in its currency relative to the dollar, New Zealand a 29% decline and Australia, a 33% decline since July 15 of the year, as shown in the third chart.
| EXCHANGE RATES | July 15, 08 | Nov 28, 08 | Depreciation | Appreciation |
|---|---|---|---|---|
| J.P. Morgan Broad Effective Exchange Rate (2000=100) | 80.7 | 94.3 | -- | 16.7% |
| Australian Dollar (US$/AUS$) | .9797 | .6546 | -33.2% | -- |
| New Zealand Dollar (US$/NZ$) | .7721 | .5500 | -28.8% | -- |
| Canadian Dollar (C$/US$) | 1.0015 | 1.286 | -22.1% | -- |
| United Kingdom Pound (US$/UKP) | 2.0036 | 1.5348 | -23.4% | -- |
| Euro (US$/Euro) | 1.5914 | 1.2694 | -20.2% | -- |
| Japanese Yen (Yen/US$) | 104.64 | 95.46 | -- | 9.62% |
| Mexico (Peso/ US$) | 10.32 | 13.39 | -22.9% | -- |
| South Korea (Won/US$) | 1006.3 | 1468.0 | -31.4% | -- |
| South Africa (Rand/US$) | 7.64 | 10.1 | -24.4% | -- |
by Tom Moeller December 1, 2008
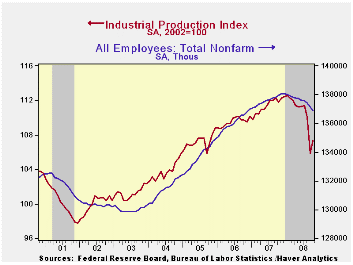
The Business Cycle Dating Committee at the National Bureau of Economic Research (NBER) determined that a U.S. recession is underway and that it began following a December 2007 peak.
The dating of a recession is dependent on several coincident indicators of U.S. economic activity including production, private sector employment and real income (less transfers). Of those variables, industrial production has fallen 4.5% since its peak, employment has fallen 1.2% and real income has dropped 0.8%. In addition real personal consumption expenditures have fallen 1.3%, corporate profits are down 5.7% and construction activity is off 1.9%.
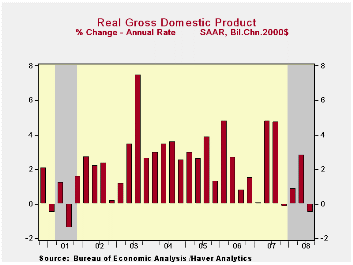
Real GDP during the last three quarters rose a very modest 0.8%, well below the economy's growth potential. Moreover, the 2008 gain likely will be eliminated by a report of what many expect will be a 4% to 5% (AR) decline in 4Q activity. Without the non-cyclical government sector, real GDP grew just 0.4% during the last three quarters.
By comparison, the largest of the postwar recessions occurred
from 1957-58 and 1973-75 when real GDP fell roughly 3.1%, and from
1981-82 when real GDP fell 2.6%. More moderate declines in activity
occurred during the 1960-61 and 1970 recessions when real GDP fell less
than 1%. The last recession happened in 2001 when real GDP fell 0.2%
peak-to-trough.
Today's announcement from the NBER can be found here.
For the dates of past economic peaks and troughs, as determined by the NBER, can be found here.
Federal Reserve Policies in the Financial Crisis is yesterday's speech by Fed Chairman Ben S. Bernanke and it can be found here.

Tom Moeller
AuthorMore in Author Profile »Prior to joining Haver Analytics in 2000, Mr. Moeller worked as the Economist at Chancellor Capital Management from 1985 to 1999. There, he developed comprehensive economic forecasts and interpreted economic data for equity and fixed income portfolio managers. Also at Chancellor, Mr. Moeller worked as an equity analyst and was responsible for researching and rating companies in the economically sensitive automobile and housing industries for investment in Chancellor’s equity portfolio. Prior to joining Chancellor, Mr. Moeller was an Economist at Citibank from 1979 to 1984. He also analyzed pricing behavior in the metals industry for the Council on Wage and Price Stability in Washington, D.C. In 1999, Mr. Moeller received the award for most accurate forecast from the Forecasters' Club of New York. From 1990 to 1992 he was President of the New York Association for Business Economists. Mr. Moeller earned an M.B.A. in Finance from Fordham University, where he graduated in 1987. He holds a Bachelor of Arts in Economics from George Washington University.
More Economy in Brief


