 Global| May 01 2009
ISM Index Suggests Modest Slowing Of Factory Sector Downturn
by:Tom Moeller
|in:Economy in Brief
Summary
The manufacturing sector showed a sign of modest improvement following several months of sharp decline in overall activity. The April composite index for the factory sector from the Institute for Supply Management rose to 40.1 from [...]
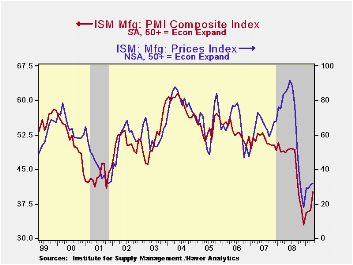
The manufacturing sector showed a sign of modest improvement following several months of sharp decline in overall activity. The April composite index for the factory sector from the Institute for Supply Management rose to 40.1 from 36.3 in March. The latest figure still indicates a lower level of activity, as does any below the break-even point of 50, but the rate of decline appears to be slowing after having reached its nadir in December. Consensus expectations were for an April reading of 38.0.
The composite index hovered for much of last year near 50, then it fell sharply in October. The production component started its decline in September. That's when factory sector output started what's been a sharp downturn with a 3.6% m/m drop, as reported by the Federal Reserve.
During the last ten years there has been an 84% correlation between the level of the production component of the composite index and the three-month growth in factory sector industrial production. It is appropriate to correlate the ISM index level with factory sector output growth because the ISM index is a diffusion index. It measures growth by using all of the positive changes in activity added to one half of the zero change in activity measures.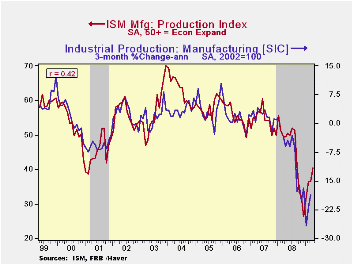
Improvement in the April components of the overall ISM index was broad-based. The new orders figure rose to 47.2 which was the highest level since last August. The improvement came as 31% of survey participants reported higher orders versus a December low of 5% while 29% reported lower orders. That was half the percentage at yearend. Even the export order index improved modestly to 44.0 versus the December reading of 35.5. During the last ten years there has been a 53% correlation between the index and the q/q change in real exports of goods in the GDP accounts.
The production component, at 40.4, was at its highest level since last September. A lessened 34% of firms reported lower production, which was near half the level this past December. The gain came despite a heightened rate of inventory decumulation. At another quite-low index level of 33.6, the inventory figure was near the lowest level since 1982.
The separate index of prices paid improved just slightly but it remained near the record low. During the last twenty years there has been a 79% correlation between the price index and the three-month change in the PPI for intermediate goods.
The ISM data is available in Haver's USECON database.
The propagation of regional recessions from the Federal Reserve Bank of St. Louis is available here.
| ISM Mfg | April | March | April '08 | 2008 | 2007 | 2006 |
|---|---|---|---|---|---|---|
| Composite Index | 40.1 | 36.3 | 48.6 | 45.5 | 51.1 | 53.1 |
| New Orders Index | 47.2 | 41.2 | 46.4 | 42.1 | 54.3 | 55.4 |
| Employment Index | 34.4 | 28.1 | 45.8 | 43.2 | 50.5 | 51.7 |
| Prices Paid Index (NSA) | 32.0 | 31.0 | 84.5 | 66.5 | 64.6 | 65.0 |
by Tom Moeller May 1, 2009
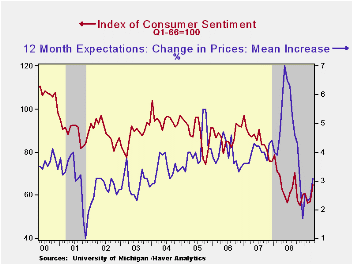
Despite lower levels of employment, the University of Michigan's April reading of consumer sentiment added to its March improvement and rose to the highest level since September of last year. The gain in the index to a level of 65.1 was steeper than the mid-month indication of a rise to 61.9 and exceeded Consensus expectations for a reading of 61.7.
The expectations component of consumer sentiment continued to show the largest improvement in April with a 17.9% rise on top of the 5.9% March rise. Expectations for business conditions during the next five years moved up by more than one-quarter m/m to the highest level since September (+14.1% y/y). Expected conditions during the next year rose by roughly the same amount m/m and they're up by more than one-third y/y. Finally, the higher stock market lifted the expected change in personal finances. The reading made up declines early this year with a 11.5% m/m increase to the highest level since September.
The current economic conditions index made up the declines of the prior two months with a 7.9% rise which was near the gain indicated mid-month. Buying conditions for large household goods recouped the declines of earlier this year while the view of current personal finances improved with the stock market and lessened growth in debt.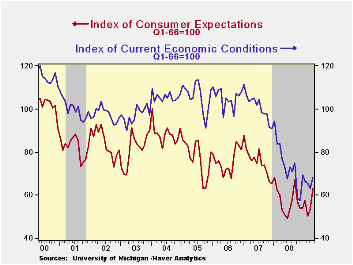
The opinion of government policy, which may eventually influence economic expectations, was roughly unchanged m/m but held onto its sharp February and March gains. The level was near the highest level since January of 2007. Twenty-one percent of respondents thought that a good job was being done by government, up from the four percent low of last December, while a much reduced 26 percent thought that a poor job was being done.
Probably reflecting the recent rise in oil prices, inflation expectations for the next year rose to 3.1% though they were as high as 7.0% last May. The median expected increase rose to 2.8% from 2.0%. The range of expectations is from slight price deflation to a 5.2% increase in prices. The expected inflation rate during the next five years rose slightly to 3.1%.
The University of Michigan survey data is not seasonally adjusted. The reading is based on telephone interviews with about 500 households at month-end; the mid-month results are based on about 300 interviews. The summary indexes are in Haver's USECON database with details in the proprietary UMSCA database.
Raising the credit bar, or getting clubbed by it? from the Federal Reserve Bank of Minneapolis can be found here.
| University of Michigan | Final-April | Mid-April | March | February | April y/y | 2008 | 2007 | 2006 |
|---|---|---|---|---|---|---|---|---|
| Consumer Sentiment | 65.1 | 61.9 | 57.3 | 56.3 | 4.0% | 63.8 | 85.6 | 87.3 |
| Current Conditions | 68.3 | 66.6 | 63.3 | 65.5 | -11.3 | 73.7 | 101.2 | 105.1 |
| Expectations | 63.1 | 58.9 | 53.5 | 50.5 | 18.4 | 57.3 | 75.6 | 75.9 |
by Tom Moeller May 1, 2009
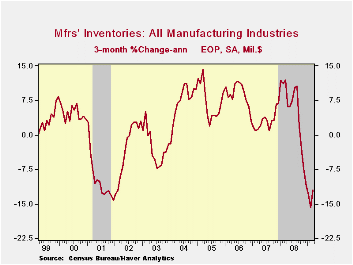
During March, the manufacturing sector continued to shed inventories at near a record rate. The 0.8% decline followed a revised 1.3% cutback during February. During the last three months the 12.1% annualized rate of stock-pile decumulation was near the record. The series dates back to 1958. That accelerated rate is in spite of a 1.0% rate of accumulation in petroleum inventories, now that prices have firmed. Excluding oil factory inventories fell at a 12.6% three-month rate that was only slightly exceeded in 2001.
The three-month rates of inventory destocking in several industries have been more than notable. Inventories of electrical equipment & appliances have fallen at a 24.1% rate while textile product inventories were down at a 34.8% clip. Steep production cutbacks pulled furniture inventories down at a 21.8% rate since December while inventories of primary metals fell at a 32.5% pace. Lesser rates of decline were registered in the machinery industry (-12.3%) and by computers & electronic products (-11.9%).
The Manufacturers' Shipments, Inventories and Orders (MSIO) data is available in Haver's USECON database.
Inventory accelerator in general equilibrium from the Federal Reserve Bank of St. Louis is available here.
| Factory Survey (NAICS, %) | March | February | Y/Y | 2008 | 2007 | 2006 |
|---|---|---|---|---|---|---|
| Inventories | -0.8 | -1.3 | -3.8 | 2.1 | 3.7 | 8.2 |
| Excluding Transportation | -0.8 | -1.5 | -6.4 | -0.6 | 2.7 | 7.9 |
| New Orders | -0.9 | 0.7 | -21.6 | 0.1 | 1.9 | 6.2 |
| Excluding Transportation | -0.9 | 0.5 | -19.0 | 3.1 | 1.2 | 7.4 |
| Shipments | -1.2 | -0.5 | -17.1 | 1.7 | 1.2 | 5.9 |
| Excluding Transportation | -1.5 | -0.6 | -17.3 | 3.7 | 1.5 | 6.7 |
| Unfilled Orders | -1.5 | -1.7 | -4.8 | 3.5 | 17.1 | 15.3 |
| Excluding Transportation | -1.5 | -2.1 | -8.7 | -1.0 | 8.2 | 16.0 |

Tom Moeller
AuthorMore in Author Profile »Prior to joining Haver Analytics in 2000, Mr. Moeller worked as the Economist at Chancellor Capital Management from 1985 to 1999. There, he developed comprehensive economic forecasts and interpreted economic data for equity and fixed income portfolio managers. Also at Chancellor, Mr. Moeller worked as an equity analyst and was responsible for researching and rating companies in the economically sensitive automobile and housing industries for investment in Chancellor’s equity portfolio. Prior to joining Chancellor, Mr. Moeller was an Economist at Citibank from 1979 to 1984. He also analyzed pricing behavior in the metals industry for the Council on Wage and Price Stability in Washington, D.C. In 1999, Mr. Moeller received the award for most accurate forecast from the Forecasters' Club of New York. From 1990 to 1992 he was President of the New York Association for Business Economists. Mr. Moeller earned an M.B.A. in Finance from Fordham University, where he graduated in 1987. He holds a Bachelor of Arts in Economics from George Washington University.
More Economy in Brief


