 Global| Apr 03 2006
ISM Index Off Unexpectedly, Pricing Pressure Up
by:Tom Moeller
|in:Economy in Brief
Summary
The March Composite Index of activity in the factory sector fell to 55.2. The Institute of Supply Management (ISM) reported that most of the prior month's increase was reversed and that the 1Q average level was the lowest since the [...]
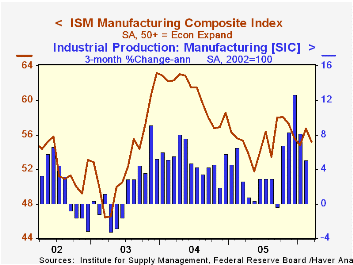
The March Composite Index of activity in the factory sector fell to 55.2. The Institute of Supply Management (ISM) reported that most of the prior month's increase was reversed and that the 1Q average level was the lowest since the second quarter of last year. Consensus expectations had been for an increase to 57.5 last month.
During the last twenty years there has been a 68% correlation between the level of the Composite Index and the three month growth in factory sector industrial production.
The new orders index reversed nearly all of the sharp improvement during February and dropped back into the range of the last nine months. Export orders slipped m/m although the 1Q index was at its highest level in nearly two years.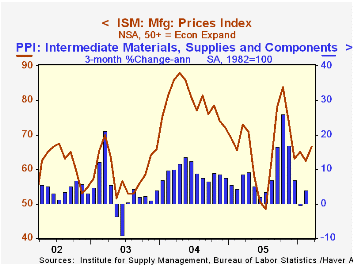
The employment index also fell sharply to its lowest level since last June. During the last twenty years there has been a 67% correlation between the level of the ISM employment Index and the three month growth in factory sector employment. Production was roughly stable m/m. The inventory index slipped but the quarterly level sustained its improved 4Q level. The supplier deliveries index rose moderately after a sharp decline during February.
The price index increased 4.0 points to its highest level since November. The Institute reported that the following commodities were up in price; aluminum, aluminum extrusions, aluminum products, carbon black, copper, copper products, corrugated containers, electronic components, flour, freight, natural rubber, paper, particle board, stainless steel, steel, hot rolled steel and sugar but that there were no commodities in short supply. During the last twenty years there has been a 77% correlation between the price index and the three month change in the PPI for intermediate goods.
Are We Engineering Ourselves Out of Manufacturing Jobs? from the Federal Reserve Bank of Cleveland can be found here.
| ISM Manufacturing Survey | Mar | Feb | Mar '05 | 2005 | 2004 | 2003 |
|---|---|---|---|---|---|---|
| Composite Index | 55.2 | 56.7 | 55.3 | 55.5 | 60.5 | 53.3 |
| New Orders Index | 58.4 | 61.9 | 57.2 | 57.4 | 63.5 | 57.9 |
| Prices Paid Index (NSA) | 66.5 | 62.5 | 73.0 | 66.4 | 79.8 | 59.6 |
by Tom Moeller April 3, 2006
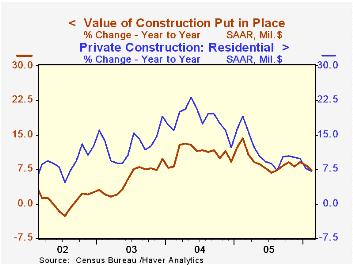
After a lackluster performance during January, the February value of construction put in place rose 0.8%, double the upwardly revised gain the prior month. Consensus expectations had been for a 0.5% increase.
Residential building surged 1.3% after an unrevised 0.1% January up tick. New single family building ballooned 1.3% (14.0% y/y) and the value of improvements rose 1.9% (-10.2% y/y), recovering all of the prior month's decline.
Your House Just Doubled in Value? Don't Uncork the Champagne Just Yet! from the Federal Reserve Bank of Philadelphia is available here.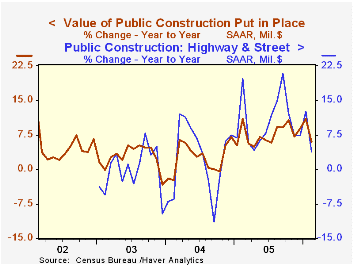
Nonresidential building gained 0.8%. Office construction jumped again, by 1.5% (16.1% y/y), and the previously reported slip during January was revised to an increase of 2.1%. Commercial building, however, fell 2.1% (+11.2% y/y) following much strength during the final nine months of 2005.
Public construction spending slipped 0.5%. Construction activity on highways & streets, nearly one third of the value of public construction spending, rose a modest 0.7% (3.8% y/y).
These more detailed categories represent the Census Bureau’s reclassification of construction activity into end-use groups. Finer detail is available for many of the categories; for instance, commercial construction is shown for Automotive sales and parking facilities, drugstores, building supply stores, and both commercial warehouses and mini-storage facilities. Note that start dates vary for some seasonally adjusted line items in 2000 and 2002 and that constant-dollar data are no longer computed.
| Construction Put-in-place | Feb | Jan | Y/Y | 2005 | 2004 | 2003 |
|---|---|---|---|---|---|---|
| Total | 0.8% | 0.4% | 7.4% | 9.2% | 10.9% | 5.4% |
| Private | 1.2% | 0.4% | 7.8% | 9.7% | 13.6% | 6.3% |
| Residential | 1.3% | 0.1% | 7.1% | 11.5% | 18.2% | 12.9% |
| Nonresidential | 0.8% | 1.2% | 9.6% | 5.4% | 3.9% | -5.4% |
| Public | -0.5% | 0.6% | 6.0% | 7.6% | 2.5% | 2.7% |
by Louise Curley April 3, 2006
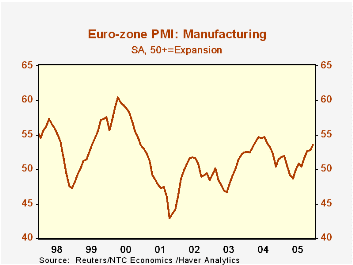
Manufacturing PMI's (Purchasing Manager's Indexes) were released today by NTC Research, Ltd. The index for the Euro Zone has been in an expansion mode (i.e. above 50) since last July. The March figure released today, 56.07, was the highest since September, 2000 as can be seen in the first chart. All of the Euro Zone members surveyed by NTC Research except the Netherlands, showed increases in March over February.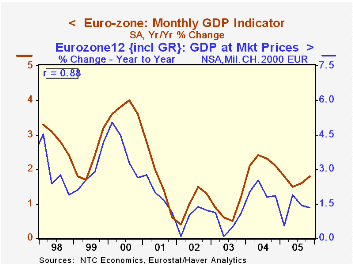
NTC Research also surveys the non Euro Zone countries--Czech Republic, Poland and Russia. In March, the PMI for the Czech Republic showed a small increase while those for Poland and Russia showed decline. All three countries, however, are still in an expansion mode.
Over the next two days, NTC Research will publish diffusion indexes for the service and construction industries. At that time they will produce their Gross Domestic Product Indicator, which is based on a weighted combination of the three industries. The GDP indicator has proved to be a fairly good indicator of the year to year changes in real GDP as can be seen in the second chart.
| March 2006 | February 2006 | % Change | |
|---|---|---|---|
| Euro Zone | 56.07 | 54.47 | 2.9 |
| France | 54.57 | 52.22 | 4.5 |
| Germany | 58.09 | 55.86 | 4.0 |
| Italy | 55.47 | 55.11 | 0.7 |
| Spain | 54.74 | 52.75 | 3.8 |
| Ireland | 52.64 | 52.42 | 0.4 |
| Netherlands | 56.18 | 56.97 | -1.4 |
| Austria | 56.52 | 54.46 | 3.8 |
| Other Europe | |||
| Czech Republic | 55.74 | 55.10 | 1.2 |
| Poland | 51.97 | 52.93 | -1.8 |
| Russia | 52.48 | 53.63 | -2.1 |

Tom Moeller
AuthorMore in Author Profile »Prior to joining Haver Analytics in 2000, Mr. Moeller worked as the Economist at Chancellor Capital Management from 1985 to 1999. There, he developed comprehensive economic forecasts and interpreted economic data for equity and fixed income portfolio managers. Also at Chancellor, Mr. Moeller worked as an equity analyst and was responsible for researching and rating companies in the economically sensitive automobile and housing industries for investment in Chancellor’s equity portfolio. Prior to joining Chancellor, Mr. Moeller was an Economist at Citibank from 1979 to 1984. He also analyzed pricing behavior in the metals industry for the Council on Wage and Price Stability in Washington, D.C. In 1999, Mr. Moeller received the award for most accurate forecast from the Forecasters' Club of New York. From 1990 to 1992 he was President of the New York Association for Business Economists. Mr. Moeller earned an M.B.A. in Finance from Fordham University, where he graduated in 1987. He holds a Bachelor of Arts in Economics from George Washington University.


