 Global| Oct 03 2005
ISM Index Lifted by Hurricane Rebuilding & Inventory Restocking
by:Tom Moeller
|in:Economy in Brief
Summary
The Institute of Supply Management reported that the Composite Index of activity in the manufacturing sector jumped unexpectedly to 59.4 from 53.6 in September. Consensus expectations had been for a decline to 52.0. During the last [...]
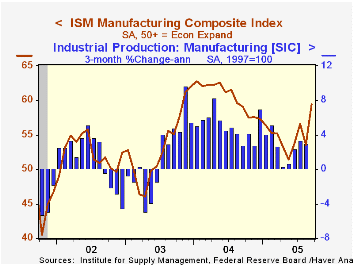
The Institute of Supply Management reported that the Composite Index of activity in the manufacturing sector jumped unexpectedly to 59.4 from 53.6 in September. Consensus expectations had been for a decline to 52.0.
During the last twenty years there has been a 64% correlation between the level of the Composite Index and the three month growth in factory sector industrial production.
Each of the index's five components rose though the 7.4 point rise in new orders to a more than one year high and a like gain in production seemed noteworthy after earlier months' easing. 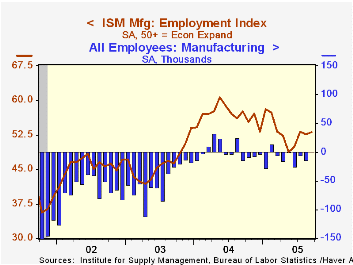
The rise in the inventories index to the second highest level of the year suggests that the destocking efforts of the prior five months are winding down. The vendor deliveries index increased to highest since last October.
The rate of factory sector job creation rose slightly though the index at 53.1 contrasts with recent government data that suggest job loss. During the last twenty years there has been a 67% correlation between the level of the ISM Employment Index and the three month growth in factory sector employment.
Pricing in the factory sector firmed even more to the highest since last October. The prices paid index rose to 78.0 on top of last month's increase.
Hurricane Katrina and the Employment Situation report for September 2005, to be released this Friday, from the U.S. Department of Labor is available here.
| ISM Manufacturing Survey | Sept | Aug | Sept '04 | 2004 | 2003 | 2002 |
|---|---|---|---|---|---|---|
| Composite Index | 59.4 | 53.6 | 59.1 | 60.5 | 53.3 | 52.4 |
| New Orders Index | 63.8 | 56.4 | 59.9 | 63.5 | 57.9 | 56.5 |
| Prices Paid Index (NSA) | 78.0 | 62.5 | 76.0 | 79.8 | 59.6 | 57.6 |
by Tom Moeller October 3, 2005
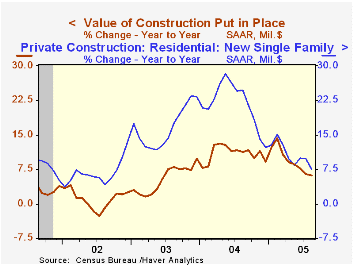
The value of construction put in place matched Consensus expectations and rose 0.4% in August following an upwardly revised 0.3% July gain.
Private building activity rose 0.4% led by a 0.8% gain in nonresidential building. Lodging building rose a strong 3.2% (-8.3% y/y) and multi-retail building added 1.6% (30.7% y/y) to the 12.5% spike in July. Office construction fell 1.1% (+4.2% y/y) for the third decline in the last four months.
Residential building rose 0.2% as new single family building increased 0.3% (7.5% y/y) for the second consecutive month. The value of residential improvements rose a modest 0.4% (-0.4% y/y) but the value is off 14.3% from the February peak.
Public construction spending rose 0.5% following upwardly revised gains during prior months led by a 1.4% (14.9% y/y) jump in construction activity on highways & streets, nearly one third of the value of public construction spending.
These more detailed categories represent the Census Bureau’s reclassification of construction activity into end-use groups. Finer detail is available for many of the categories; for instance, commercial construction is shown for Automotive sales and parking facilities, drugstores, building supply stores, and both commercial warehouses and mini-storage facilities. Note that start dates vary for some seasonally adjusted line items in 2000 and 2002 and that constant-dollar data are no longer computed.
| Construction Put-in-place | Aug | July | Y/Y | 2004 | 2003 | 2002 |
|---|---|---|---|---|---|---|
| Total | 0.4% | 0.3% | 6.1% | 10.9% | 5.4% | 1.0% |
| Private | 0.4% | 0.1% | 5.3% | 13.6% | 6.3% | -0.4% |
| Residential | 0.2% | 0.0% | 5.9% | 18.2% | 12.9% | 8.5% |
| Nonresidential | 0.8% | 0.4% | 3.7% | 3.9% | -5.4% | -13.0% |
| Public | 0.5% | 0.6% | 9.2% | 2.5% | 2.7% | 5.7% |
by Louise Curley October 3, 2005
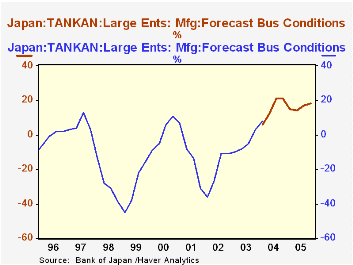
Preliminary results of .the Bank of Japan's Tankan Survey were moderately disappointing, falling short of consensus expectations. The percent balance between optimists and pessimists evaluating the current conditions in the third quarter was 19%, compared with 18% for the second quarter. The consensus was 20-21%. The forecast for the fourth quarter is for an excess of 18% for optimists over pessimists. Although the results have fallen short of expectation, they continue to show a healthy increase of optimists over pessimists, compared to the past, as can be seen in the two attached charts, which show the appraisals of current conditions and forecasts for the following quarter. To show some perspective we have added the DISCONTINUED series to the current data that are available only from early 2004.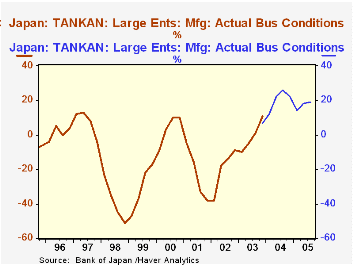
The major differences between the current and the discontinued series are (1) a revised industrial classification, (2) changed sampling measures to conform with the 2001 census and (3) a change in the definition of size from one based on the number of employees to one based on capitalization.
Several commentators have suggested that the high price of oil has played a significant role in dampening business confidence. In an interview with the Financial Times, Kazuo Momma, head of economic assessment and projection at the bank of Japan, while granting the serious direct effects of the high price of oil on Japanese business confidence, also stressed his longer term concerns. "We are more worried about the indirect, second wave effects coming from the slowdown of the world economy, particularly the US and China."
| Tankan Survey | Q 4 05 | Q3 05 | Q2 04 | Q1 05 | Q4 04 | Q3 04 | Q2 04 | Q1 04 |
|---|---|---|---|---|---|---|---|---|
| Large Manufacturing Enterprises | ||||||||
| Current Conditions | 19 | 18 | 14 | 22 | 26 | 22 | 12 | |
| Forecast | 18 | 17 | 14 | 15 | 21 | 21 | 12 | 6 |

Tom Moeller
AuthorMore in Author Profile »Prior to joining Haver Analytics in 2000, Mr. Moeller worked as the Economist at Chancellor Capital Management from 1985 to 1999. There, he developed comprehensive economic forecasts and interpreted economic data for equity and fixed income portfolio managers. Also at Chancellor, Mr. Moeller worked as an equity analyst and was responsible for researching and rating companies in the economically sensitive automobile and housing industries for investment in Chancellor’s equity portfolio. Prior to joining Chancellor, Mr. Moeller was an Economist at Citibank from 1979 to 1984. He also analyzed pricing behavior in the metals industry for the Council on Wage and Price Stability in Washington, D.C. In 1999, Mr. Moeller received the award for most accurate forecast from the Forecasters' Club of New York. From 1990 to 1992 he was President of the New York Association for Business Economists. Mr. Moeller earned an M.B.A. in Finance from Fordham University, where he graduated in 1987. He holds a Bachelor of Arts in Economics from George Washington University.
More Economy in Brief


