 Global| Jan 05 2009
ISM Index Fell To The Lowest Since1980
by:Tom Moeller
|in:Economy in Brief
Summary
On Friday, the Institute for Supply Management (ISM) reported that its December Composite Index of Activity in the manufacturing sector fell further to 32.4, the lowest level since the recession year of 1980. The index fell 3.8 points [...]
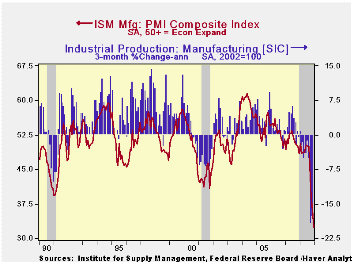
On Friday, the Institute for Supply Management (ISM) reported that its December Composite Index of Activity in the manufacturing sector fell further to 32.4, the lowest level since the recession year of 1980. The index fell 3.8 points from November for the sixth consecutive monthly decline. The break-even level for this diffusion index of factory sector activity is a level of 50.
During the last twenty years there has been a 64% correlation between the level of the Composite Index and the three-month growth in factory sector industrial production.
It is appropriate to correlate the ISM index level with factory sector growth because the ISM index is a diffusion index. It measures growth by using all of the positive changes in activity added to one half of the zero change in activity measures.
The separate index of prices paid fell another 7.5 points to 18.0 which remained the lowest level since 1949. During the last twenty years there has been a 79% correlation between the price index and the three-month change in the PPI for intermediate goods.
During the last three months the ISM index composite index
fell by nearly eighteen points, the steepest three-month decline since
1981, near the beginning of that year's recession. The current index
level is, in addition, below the level reached during that downturn
suggesting that the current drop in factory sector activity will exceed
the five-to-seven percent rates of decline reached then.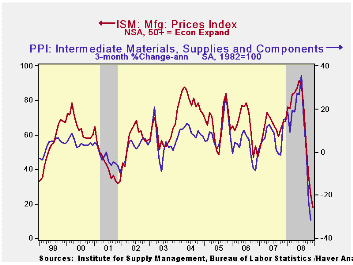
The new orders index during December fell to a record low of 22.7. Only 5% of survey participants reported higher orders while 64% reported that orders fell. The export order index continued to reflect economic weakness outside of the U.S. as it fell to 35.5, the lowest level in this index's short twenty year history. During the last ten years there has been a 53% correlation between the index and the q/q change in real exports of goods in the GDP accounts.
The production sub-series also fell to a record low of 25.5, off 26 points during the last six months. Sixty percent of survey participants reported lower production while seven percent indicated that production rose. In addition, the employment index fell 4.3 points to 29.9, the lowest reading since 1981. Fifty percent reported that they reduced employment. During the last twenty years there has been a 67% correlation between the level of the ISM employment index and the three-month growth in factory sector employment.
Deficits, Debt and Looming Disaster from the Federal Reserve Bank of St. Louis can be found here
| ISM Mfg | December | November | December '07 | 2008 | 2007 | 2006 |
|---|---|---|---|---|---|---|
| Composite Index | 32.4 | 36.2 | 48.4 | 45.6 | 51.1 | 53.1 |
| New Orders Index | 22.7 | 27.9 | 46.9 | 42.1 | 54.3 | 55.4 |
| Employment Index | 29.9 | 34.2 | 48.7 | 43.3 | 50.5 | 51.7 |
| Prices Paid Index (NSA) | 18.0 | 25.5 | 68.0 | 66.5 | 64.6 | 65.0 |
U.S. Monetary Policy: Pushing On A String?
by Tom Moeller January 5, 2009
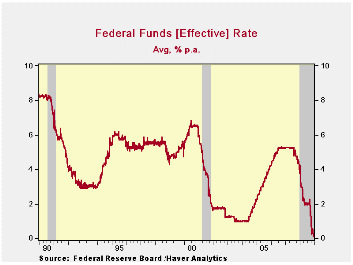
Federal Reserve Board Chairman Ben S. Bernanke recently addressed the effects of the housing market's contraction on the financial markets. In reaction to the market's meltdown, and the depressing effects on consumer & business spending, the U.S. Federal Reserve has eased monetary policy quite aggressively. Though targeted at 0.5% to 1.0%, the effective Federal funds rate now trades near 0.2% or lower, the lowest in fifty years. Also, the Fed created a new lending facility called the Term Asset-Backed Securities Loan Facility (TALF).
In reaction, the adjusted monetary base has surged. It has nearly doubled to $1.5 trillion as the Federal Reserve has provided banks with billions of added liquidity to shore up balance sheets and provide lending. Moreover, the Fed has accommodated an increase in the demand for cash balances. That has prompted the money stock (M2) to rise at an accelerated 13.6% annual rate during the last three months, up from little growth this passed summer.
As of yet, the current round of easing has paid few economic
dividends. Consumer spending has collapsed as have corporate profits
and business spending. A crisis of confidence, consumer and business,
is in evidence. Is the Fed pushing on the proverbial string? Monetary
ease does not usually generate an economic impact for three-to-six
months after rates are lowered. But these are not normal times. Credit
creation played a large part in the U.S. economy's growth during the
last several years and the unwinding of that leverage should similarly
take some time. Just how much leverage was created during the last few
years and might now need to be unwound? Since the last recession
occurred in 2001, and it was a mild one, the growth in assets (debt)
held by commercial U.S. banks averaged 9.2% per year. That was the
quickest growth since the mid-1980s, a time of faster growth in
productive capacity, both of labor and of capital. Finance companies
extended credit at an average rate of 11.5% annually. Therefore credit
extension could be modest for the foreseeable future.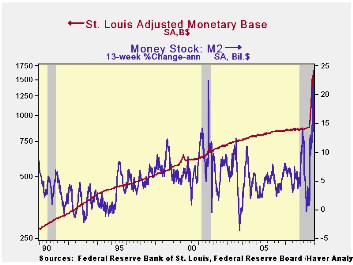
So why was there the overshoot of debt creation for which there now is a period of payback? Interest rates were held low from 2002 to 2004 as worries about price inflation subsided. In 2003, FOMC meeting minutes indicate a focus on economic growth that had been below its potential lifted by strong productivity gains, declining inflation expectations and a general absence of pricing power. Indeed inflation was more than under control. Occasionally, in the early-2000's, there was use of the word deflation and a modest concern on the part of the Fed that as inflation fell, monetary policy was tightening. Low interest rates were deemed appropriate. After 2004, debt growth surged as new credit vehicles were created, employment rose and home prices surged.
Will the Fed's current flood of liquidity be successful in stimulating economic growth? The answer is eventually, but most forecasters suggest not until the middle of next year. Chairman Bernanke recently observed that even if financial markets start to improve, consumer spending would remain depressed by the fall in household wealth and a lack of credit availability. Most agree that it will not be a V-shaped recovery. Credit extension could be under wraps for some time.
Typically, the Fed might worry that aggressive easing
(flooding the economy with money) would eventually spur inflation
higher. In fact the credit markets already are worrying. The spread
between the yield on 10-year Treasury notes and the Fed funds rate has
widened to 207 basis points. Though that's down in recent weeks from
its steepest spread of over 300 basis points, it compares to a zero or
negative spread during 2006 and 2007.
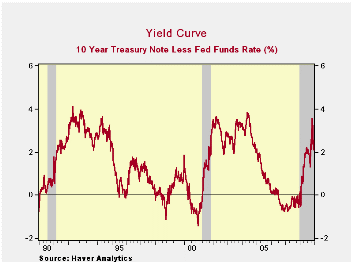
With regard to the more steeply sloped interest rate yield curve, is the market's concern about a rise in inflation justified? The definitive answer is "probably not." A pickup in inflation would normally be expected to appear after economic growth exceeded its "potential" for some time. Current potential growth in GDP, which is labor force growth plus productivity growth, likely is 2.5%. Thus, in this case given the current multi-year period of moderate growth that seems yet to come, inflation should not pick up for years. The recent collapse in oil prices, if sustained, certainly will diffuse inflationary pressure. However, there is a wild card scenario ... one of "stagflation." It could colloquially be described as too much money chasing too few goods. We'll have to keep our eyes open for that is a threat.
From one respected source for comprehensive economic forecasts, go to the Haver database MA4CAST which has forecasts from Macroeconomic Advisers in St. Louis, MO. They foresee inflation declining through the end of next year then picking up slightly. As for economic growth, modest after the current recession ends next quarter then a healthy rebound later in 2010.
The data used for the charts above can be found in Haver's USECON and USWEEKLY databases. Go to http://www.haver.com/ to learn more.
Globalization and the Changing Nature of the U.S. Economy’s Influence in the World from the Federal Reserve Bank of Dallas is available here.
U.S. Construction Spending Off Further Due to Housing Decline
by Tom Moeller January 5, 2009
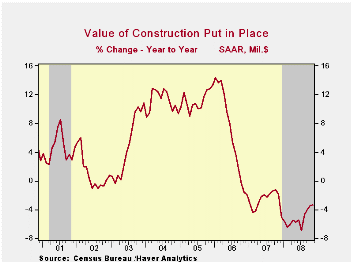
During November, the value of construction put in place fell another 0.6% though the decline during October was lessened to 0.4%. So far this year total construction spending is down 1.4%. The 20.7% decline in the value of residential building has been mitigated by an 11.6% gain in the nonresidential category and an 8.8% rise in public construction. Consensus expectations had been for a 1.2% November decline.
Residential building activity led the latest monthly decline. The 4.2% drop was the third in a row and activity remained off by one quarter from last year. Single-family construction activity fell 6.6% and it's off by nearly one half year-to-year. Building activity on multi-family units also was weak and it posted a 1.8% decline (-2.6 y/y), off 20% from the early-2007 peak. Spending on improvements fell a sharp 2.1% m/m (+8.1% y/y).
During the last twenty years there has been an 84% correlation between the q/q change in the value of residential building and its contribution to growth in real GDP.
The value of nonresidential building activity has remained
firm relative to the residential sector. During November it posted a
0.7% gain and that pulled activity up 10.3% y/y, though that momentum
is down by half from last year. Spending on office construction rose
about as it did during October, by 0.9%, but the y/y gain of 5.0% is
much reduced from the near 20% growth of the prior two years. Building
in the multi-retail sector was unchanged m/m and it was down 15.0% y/y
after a 17.0% gain last year and a 28.3% pop during 2006. Spending on
health care facilities reversed much of an October decline with a 0.8%
increase and y/y growth near 8.6% has been steady.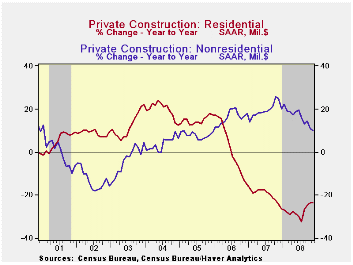
Public construction rose another 1.4% and the 1.7% October gain was revised sharply upward from the preliminary report. Spending on public safety surged by 10.2% and it's up by one-third year-to-year. The value of spending on transportation facilities fell 1.9% but the y/y increase of 5.4% remained firm. Spending on highways & streets rose 1.3% (8.3% y/y). The value of construction on highways & streets is roughly one-third of the value of total public construction spending.
The more detailed categories of construction represent the Census Bureau’s reclassification of construction activity into end-use groups. Finer detail is available for many of the categories; for instance, commercial construction is shown for automotive sales and parking facilities, drugstores, building supply stores, and both commercial warehouses and mini-storage facilities. Note that start dates vary for some seasonally adjusted line items in 2000 and 2002, and that constant-dollar data are no longer computed.
| Construction (%) | November | October | Y/Y | 2007 | 2006 | 2005 |
|---|---|---|---|---|---|---|
| Total | -0.6 | -0.4 | -3.3 | -2.7 | 6.3 | 11.2 |
| Private | -1.5 | -1.2 | -7.4 | -6.9 | 5.5 | 12.7 |
| Residential | -4.2 | -2.1 | -23.4 | -19.8 | 1.0 | 14.9 |
| Nonresidential | 0.7 | -0.4 | 10.3 | 19.6 | 16.2 | 7.8 |
| Public | 1.4 | 1.7 | 7.9 | 12.3 | 9.3 | 6.2 |
More Evidence of Declining Inflation
by Louise Curley January 5, 2009
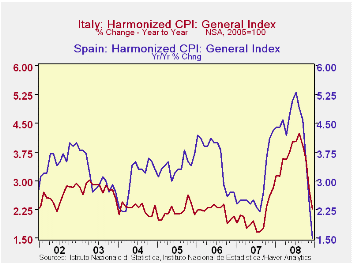
Among the data released today were the Consumer Price Indexes
in December for a number of countries--Spain and Italy in Europe and
Indonesia, Thailand and Taiwan in Asia. The year to year percentage
changes in the indexes show that inflation has come down dramatically
in all but Indonesia since mid year. And even in Indonesia, which has
experienced relatively high inflation, partly as a result of the
natural disasters that have plagued the nation since the devastating
tsunami of 2004, inflation has fallen in each month since September.
The first chart show inflation in Spain and Italy and the second,
inflation in Thailand, Taiwan and Indonesia.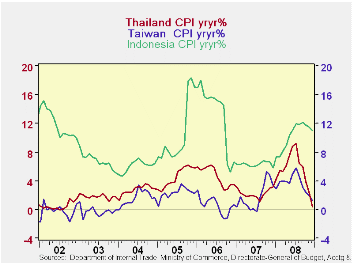
Much of the decline in inflation is due to the decline in the price of oil. Brent crude was $144 a barrel on July 11 and $35 on December 30. But increasingly it has been the performance of the economy that is exerting downward pressure on prices. Residential construction is way down, consumer demand is falling as is business investment. Fear of deflation is beginning to replace fear of inflation. Inflation in Thailand, for example, was less than 0.5% in the month of December, down from 9.2% in July. Less dramatic but still significant is the decline in inflation in Spain from 5.3% in July to 1.5% in December.
| INFLATION Y/Y % CHANGE IN CPI | Dec 08 | Nov 08 | Oct 08 | Sep 08 | Aug 08 | July 08 |
|---|---|---|---|---|---|---|
| Italy | 2.26 | 2.74 | 3.60 | 3.92 | 4.23 | 4.03 |
| Spain | 1.50 | 2.40 | 3.60 | 4.60 | 4.90 | 5.30 |
| Thailand | 0.42 | 2.19 | 3.89 | 6.05 | 6.43 | 9.21 |
| Taiwan | 1.21 | 1.88 | 2.39 | 3.10 | 4.68 | 5.81 |
| Indonesia | 11.06 | 11.42 | 11.77 | 12.15 | 11.85 | 11.90 |

Tom Moeller
AuthorMore in Author Profile »Prior to joining Haver Analytics in 2000, Mr. Moeller worked as the Economist at Chancellor Capital Management from 1985 to 1999. There, he developed comprehensive economic forecasts and interpreted economic data for equity and fixed income portfolio managers. Also at Chancellor, Mr. Moeller worked as an equity analyst and was responsible for researching and rating companies in the economically sensitive automobile and housing industries for investment in Chancellor’s equity portfolio. Prior to joining Chancellor, Mr. Moeller was an Economist at Citibank from 1979 to 1984. He also analyzed pricing behavior in the metals industry for the Council on Wage and Price Stability in Washington, D.C. In 1999, Mr. Moeller received the award for most accurate forecast from the Forecasters' Club of New York. From 1990 to 1992 he was President of the New York Association for Business Economists. Mr. Moeller earned an M.B.A. in Finance from Fordham University, where he graduated in 1987. He holds a Bachelor of Arts in Economics from George Washington University.
More Economy in Brief


