 Global| Jan 03 2006
ISM Index Fell Further
by:Tom Moeller
|in:Economy in Brief
Summary
The Institute of Supply Management (ISM) reported that the December Composite Index of activity in the manufacturing sector fell for the fourth month in the last five. The sharp 3.9 point decline to 54.2 was the largest since 2002, [...]
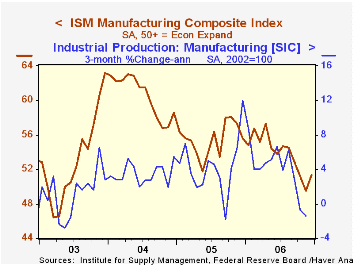
The Institute of Supply Management (ISM) reported that the December Composite Index of activity in the manufacturing sector fell for the fourth month in the last five. The sharp 3.9 point decline to 54.2 was the largest since 2002, dropped the index to the lowest level since August and exceeded Consensus expectations for a more moderate decline to 57.4.
During the last twenty years there has been a 64% correlation between the level of the Composite Index and the three month growth in factory sector industrial production.
Each of the index's five components fell last month. The 4.3 point drop in new orders was to the lowest level since July and the 3.6 point drop in production was the fourth in the last five months.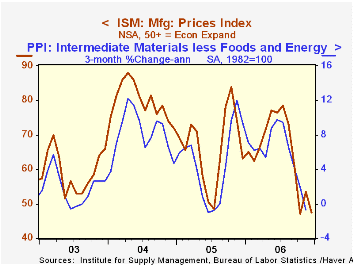
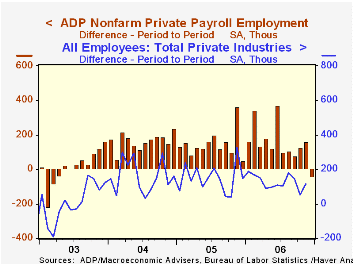
The 3.9 point decline in the employment index reversed about all of the gains during the prior three months. During the last twenty years there has been a 67% correlation between the level of the ISM Employment Index and the three month growth in factory sector employment.
Prices continued to rise, though an eleven point decline in the index level added to the ten point drop in November. Widespread increases in commodities prices were offset by limited declines in diesel fuel and resins. Commodities in short supply were caustic soda, plastics, resins, and steel.The Diffusion of Personal Computers across the U.S. from the Federal Reserve Bank of San Francisco is available here.
| ISM Manufacturing Survey | Dec | Nov | Dec '04 | 2005 | 2004 | 2003 |
|---|---|---|---|---|---|---|
| Composite Index | 54.2 | 58.1 | 57.3 | 55.5 | 60.5 | 53.3 |
| New Orders Index | 55.5 | 59.8 | 62.6 | 57.5 | 63.5 | 57.9 |
| Prices Paid Index (NSA) | 63.0 | 74.0 | 72.0 | 66.4 | 79.8 | 59.6 |
by Tom Moeller January 3, 2006
The value of construction put in place rose a modest 0.2% in November following a 0.8% October increase and fell far short of Consensus expectations for a 0.7% rise.
Residential building dropped modestly for the first decline since June. The decline reflected a 4.1% plunge in the value of improvements (-5.7% y/y) and a 0.6% fall in new multi-family residential (+20.5% y/y). New single family building posted a strong 1.5% gain (14.8% y/y) which was on a par with increases during the prior ten months.
Nonresidential building recovered all of the previous month's 0.6% drop helped by a 2.4% gain in office construction (7.4% y/y) and a 2.7% rise in commercial (10.15 y/y).
Public construction spending rose 0.3% following a revised 1.7% increase during October. Construction activity on highways & streets, nearly one third of the value of public construction spending, rose 1.6% (8.1% y/y).
These more detailed categories represent the Census Bureau’s reclassification of construction activity into end-use groups. Finer detail is available for many of the categories; for instance, commercial construction is shown for Automotive sales and parking facilities, drugstores, building supply stores, and both commercial warehouses and mini-storage facilities. Note that start dates vary for some seasonally adjusted line items in 2000 and 2002 and that constant-dollar data are no longer computed.
| Construction Put-in-place | Nov | Oct | Y/Y | 2004 | 2003 | 2002 |
|---|---|---|---|---|---|---|
| Total | 0.2% | 0.8% | 7.8% | 10.9% | 5.4% | 1.0% |
| Private | 0.2% | 0.5% | 7.8% | 13.6% | 6.3% | -0.4% |
| Residential | -0.0% | 0.9% | 9.7% | 18.2% | 12.9% | 8.5% |
| Nonresidential | 0.6% | -0.6% | 3.2% | 3.9% | -5.4% | -13.0% |
| Public | 0.3% | 1.7% | 7.8% | 2.5% | 2.7% | 5.7% |
by Louise Curley January 3, 2006
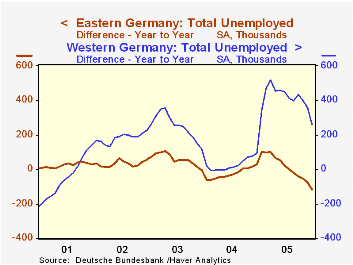
Signs of improvement in the German economy have been coming to the fore. The latest bit of good news relates to unemployment conditions. The Federal Labor Agency reported that the number of registered workers without work adjusted for seasonal swings, in December fell by 110,000 to 4.64 million. the biggest drop since reunification. The unemployment rate fell to 11.2% from 11.4%. Registered unemployment in West Germany was 82, 000 lower in December than November, but was still 260,000 above December, 2004. Registered unemployment in East Germany, declined in December by 28,000 from November but was also 115,000 below December, 2004. The first chart shows the year to year changes in the number of registered unemployment in West and East Germany. The unemployment data in Germany were distorted early in 2005 when 200,000 people were added to the unemployment roles under the new definitions introduced by Hartz IV of the labor reforms.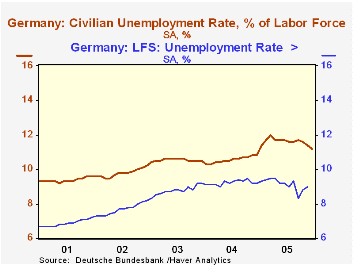
In addition to the data on registered unemployment, the Federal Statistical Office publishes data based on concepts of the the International Labor Office (ILO). These data do not show the early 2005 distortion in the unemployment figures. The second chart compares the unemployment rate as measured by the two agencies. There is no rise in the rate of ILO unemployment in early 2005 comparable to that of the registered unemployment rate. According to the ILO concept, the unemployment rate appears to have shown a somewhat steeper down trend so far this year than the registered data. The latest data are for November. While employment rose by 15,0000 in November on a seasonally adjusted basis to 38,611 million, unemployment also rose by 7,000, taking the unemployment rate to 9.0% from 8.8% in October.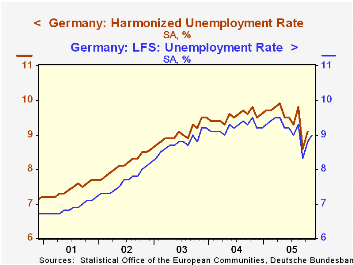
The ILO data form the basis of Eurostat's harmonized rates of unemployment for all the Euro Zone countries, but, as can seen in the third chart that compares Germany's ILO unemployment rate and the Eurostat harmonized rate, further adjustments are made to the harmonized indexes. The latest Eurostat Harmonized Index for Germany is October.
| Number of Registered Unemployed, S. A. (000) | Dec 05 | Nov 05 | Dec 04 | M/M Dif | Y/Y Dif | 2005 | 2004 | 2003 | 2002 |
|---|---|---|---|---|---|---|---|---|---|
| Unified Germany | 4638 | 4748 | 4493 | -110 | 145 | 4803 | 4389 | 4383 | 4075 |
| West Germany | 3122 | 3204 | 2862 | -82 | 266 | 3201 | 2789 | 2759 | 2509 |
| East Germany | 1516 | 1544 | 1631 | -28 | -115 | 1612 | 1600 | 1624 | 1585 |
| Unemployment Rate | 11.2 | 11.4 | 10.8 | -0.2 | 0.4 | 11.6 | 10.5 | 10.5 | 9.8 |
| ILO Concept S. A. (000) | Nov 05 | Oct 05 | Nov 04 | M/M Dif | Y/Y Dif | 2004 | 2003 | 2002 | |
| Employment | 38611 | 38596 | 38826 | 15 | -215 | 38779 | 38632 | 383992 | |
| Unemployment | 3800 | 3730 | 3910 | 70 | 110 | 3930 | 3710 | 3240 | |
| Unemployment Rate | 9.0 | 8.8 | 9.2 | 0.2 | -0.2 | 9.2 | 8.8 | 7.7 | |
| Eurostat Harmonized Rate for Germany | n.a | 9.1 | 9.5 | 9.5 | 9.1 | 8.2 |

Tom Moeller
AuthorMore in Author Profile »Prior to joining Haver Analytics in 2000, Mr. Moeller worked as the Economist at Chancellor Capital Management from 1985 to 1999. There, he developed comprehensive economic forecasts and interpreted economic data for equity and fixed income portfolio managers. Also at Chancellor, Mr. Moeller worked as an equity analyst and was responsible for researching and rating companies in the economically sensitive automobile and housing industries for investment in Chancellor’s equity portfolio. Prior to joining Chancellor, Mr. Moeller was an Economist at Citibank from 1979 to 1984. He also analyzed pricing behavior in the metals industry for the Council on Wage and Price Stability in Washington, D.C. In 1999, Mr. Moeller received the award for most accurate forecast from the Forecasters' Club of New York. From 1990 to 1992 he was President of the New York Association for Business Economists. Mr. Moeller earned an M.B.A. in Finance from Fordham University, where he graduated in 1987. He holds a Bachelor of Arts in Economics from George Washington University.
More Economy in Brief


