 Global| Mar 03 2008
ISM Index Factory Sector Falls Below 50: Indicates Contraction
by:Tom Moeller
|in:Economy in Brief
Summary
For the second month in the last three, the Institute of Supply Management (ISM) reported that its Composite Index of Manufacturing Sector Activity was below the breakeven level of 50. The m/m decline to 48.3 was right in line with [...]
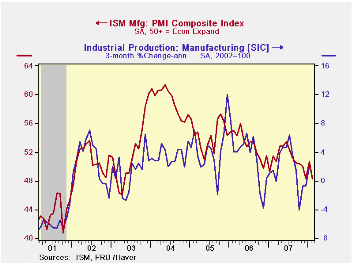
For the second month in the last three, the Institute of Supply Management (ISM) reported that its Composite Index of Manufacturing Sector Activity was below the breakeven level of 50. The m/m decline to 48.3 was right in line with Consensus expectations for a drop to 48.4. Data points above 50 indicate growth in factory sector activity.
Last month's composite reading was down from 50.7 in January and 48.4 in December. The three month average level of 49.1 was its lowest since early 2003.
During the last twenty years there has been a 64% correlation between the level of the Composite Index and the three month growth in factory sector industrial production.
It is appropriate to correlate the ISM index level
with factory sector growth because the ISM index
is a diffusion index. It measures growth by being constructed using all
of the absolute positive changes in activity added to one half of the
no change in activity measures.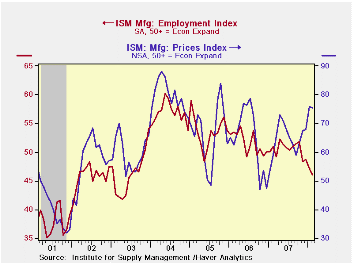
Sharp declines in each of the five component series, excepting new orders, contributed to last month's decline in the composite index. Production fell 4.5 points and reversed most of its January recovery. The inventory component fell 3.7 points and reversed all of its January rise while the vendor deliveries component fell 2.7 points to the lowest level since 2003.
The employment index fell a sharp 1.1 points, repeating most of the January decline, to the lowest level since 2003. During the last twenty years there has been a 67% correlation between the level of the ISM employment Index and the three month growth in factory sector employment.
The new orders index fell a more moderate 0.4 points although domestic orders may have held up. The index of new export orders fell a sharp 2.5 points to 56.0, back to the average level during 4Q07 and 3Q07.
The prices paid index continued firm. A modest 0.5 point downtick during February followed very strong gains in three of the prior four months. That left the index at its highest level since August 2006. During the last twenty years there has been a 77% correlation between the price index and the three month change in the PPI for intermediate goods.
The Benefits of Systematic Monetary Policy is today's speech by Philadelphia Fed President Charles I. Plosser and it can be found here.
| ISM Mfg | February | January | February '07 | 2007 | 2006 | 2005 |
|---|---|---|---|---|---|---|
| Composite Index | 48.3 | 50.7 | 51.5 | 51.1 | 53.1 | 54.4 |
| New Orders Index | 49.1 | 49.5 | 55.4 | 54.3 | 53.4 | 57.4 |
| Employment Index | 46.0 | 47.1 | 50.9 | 50.5 | 51.7 | 53.6 |
| Prices Paid Index (NSA) | 75.5 | 76.0 | 59.0 | 64.6 | 65.0 | 66.4 |
by Tom Moeller March 3, 2008
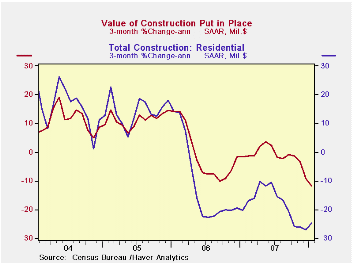
The value of construction put in place fell 1.7% during January, roughly repeating its little revised 1.3% December downdraft. The latest decline was the forth consecutive monthly drop but the last two were by far the largest of the bunch. Activity during the opening month of 2008 was 1.7% below the 4Q07 average. A 0.7% decline had been generally expected in January construction activity.
For the first month since late 2006, the value of nonresidential building activity fell. Building in the lodging area fell 3.0% (+55.1 y/y) and roughly repeated its downwardly revised 2.7% December decline. Office construction rose a modest 0.7% (7.1% y/y) but a previously reported large December gain was revised away. Multi-unit retail (shopping malls) fell 2.3% (+1.6% y/y).
Growth in the nonresidential area continued with a 2.1% (21.8% y/y) rise in education. Spending in the factory sector ticked up 0.1% (31.7 y/y) after little revised, very strong gains during the prior four months. Spending in the transportation area fell 0.8% (+15.2% y/y) and spending in the health care industry fell 1.0% (+4.8% y/y).
Private construction in total fell another 2.2%, pulled down further by a 3.0% drop in residential building, the largest since last October. Construction activity on new single family units tumbled 5.2% (-32.1% y/y), about the rate of decline as during the prior five months. Building activity on multi-family units also fell a sharp 1.7% (-18.6% y/y) while spending on improvements ticked down 0.2% (+5.2% y/y).
Housing and the "R" Word from the Federal Reserve Bank of St. Louis can be found here .
During the last twenty years there has been an 84% correlation between the q/q change in the value of residential building and its contribution to growth in real GDP.
Public construction spending fell slightly, by 0.2%. Construction on highways & streets fell 1.3% (+0.9% y/y) for the third consecutive monthly decline. The value of construction on highways & streets is nearly one third of the value of total public construction spending.
These more detailed categories represent the Census Bureau’s reclassification of construction activity into end-use groups. Finer detail is available for many of the categories; for instance, commercial construction is shown for Automotive sales and parking facilities, drugstores, building supply stores, and both commercial warehouses and mini-storage facilities. Note that start dates vary for some seasonally adjusted line items in 2000 and 2002 and that constant-dollar data are no longer computed.
| Construction | January | December | Y/Y | 2007 | 2006 | 2005 |
|---|---|---|---|---|---|---|
| Total | -1.7% | -1.3% | -3.3% | -2.7% | 5.6% | 10.7% |
| Private | -2.2% | -1.3% | -6.4% | -6.8% | 4.7% | 12.0% |
| Residential | -3.0% | -2.6% | -19.7% | -18.1% | 0.5% | 13.7% |
| Nonresidential | -1.2% | 0.4% | 17.3% | 18.0% | 15.2% | 7.8% |
| Public | -0.2% | -1.6% | 6.6% | 12.3% | 9.2% | 6.2% |
by Louise Curley March 3, 2008
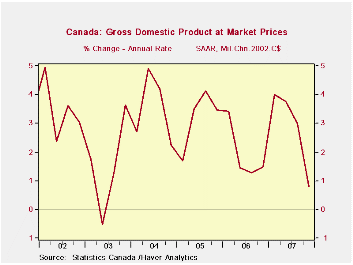
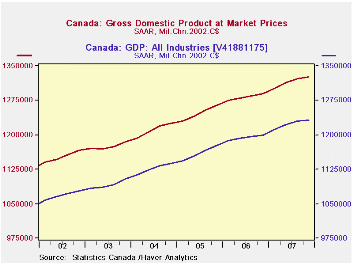
Growth in the Canadian economy slowed in the fourth quarter of 2007 to 0.79% at an annual rate, the slowest rate of increase since the second quarter of 2003 as can be seen in the first chart. For the year as a whole, GDP increased 2.65% compared with 2.76% in 2006.
In addition to the traditional quarterly series of GDP, Canada also maintains a monthly series that is less comprehensive than the quarterly series. The two series are compared in the second chart. The monthly series has been aggregated to a quarterly basis for comparison.
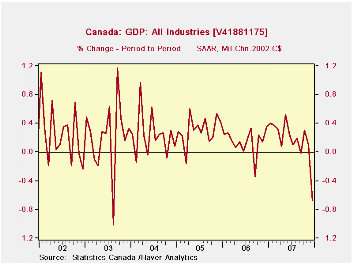
The monthly series shows that the rate of growth deteriorated sharply in the months of the final quarter. GDP in December was .67% below November, as can be seen in the third chart.
The strength of the Canadian dollar which has affected exports adversely and has encouraged imports has accounted for some of the slow down in the Canadian economy. Last Friday, Canada announced a deficit on its current account of $513 million Canadian, the first since the second quarter of 1999.
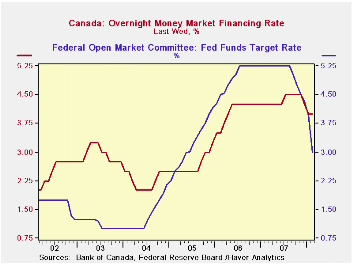
As a result of the slow growth, there is growing speculation that when the central bank meets tomorrow it will lower its target rate of 4%. The target interest rate of Canada is shown in the fourth chart with that of the United States.
| CANADA | Q4 07 | Q3 07 | Q2 07 | Q1 07 |
|---|---|---|---|---|
| GDP Quarterly Series (Percent Change at Annual Rate) | 0.79 | 2.98 | 3.76 | 4.01 |
| GDP Monthly Series (Percent Change at Annual Rate) | 0.80 | 2.25 | 3.41 | 4.23 |
| Current Account (Million C$) | -513 | 1335 | 6400 | 6960 |
| Dec 07 | Nov 07 | Oct 07 | Sep 07 | |
| GDP Monthly (Percent Change M/M) | -0.67 | 0.10 | 0.31 | -0.02 |
by Robert Brusca March 3, 2008
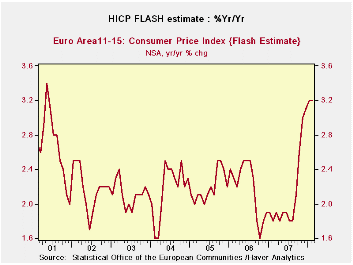
The new FLASH estimate of EMU inflation stands at 3.2%
year/year in February 2008 the same pace as in January.
Germany's own headline rate rose by 0.2% in February and
that is the rate implied by the new 3.2% for all of EMU (no month/month
rate is released but one can be calculated form the released data but
with less overall precision). Even
with flaring oil prices headline inflation is not accelerating over the
sequential monthly rates. AT 2.5% the 3-month pace is much better than
the 4.3% over six months and 3.2% year/year but still above the ECB’s
desired ceiling of 2%. German inflation data which are up-to-date show
the same dampening of inflation trends. Italy does not.
| Trends in EMU HICP; Flash Index | |||||||
|---|---|---|---|---|---|---|---|
| % month/month | % saar | ||||||
| Feb-08 | Jan-08 | Dec-07 | 3-Mo | 6-Mo | 12-Mo | Yr Ago | |
| EMU-13 | 0.2% | 0.3% | 0.2% | 2.5% | 4.3% | 3.2% | 1.9% |
| Core | #N/A | 0.1% | 0.2% | 2.5% | 2.7% | 2.3% | 1.8% |
| Goods | #N/A | -0.5% | 0.1% | 2.0% | 4.8% | 3.7% | 1.5% |
| Services | #N/A | -0.2% | 0.9% | 2.4% | 0.4% | 2.5% | 2.3% |
| HICP | |||||||
| Germany | 0.2% | 0.3% | -0.2% | 1.1% | 3.9% | 2.9% | 2.0% |
| France | #N/A | 0.3% | 0.4% | 5.9% | 4.6% | 3.2% | 1.4% |
| Italy | 0.6% | 0.1% | 0.4% | 4.2% | 4.7% | 3.1% | 2.2% |
| Spain | #N/A | 0.2% | 0.5% | 6.5% | 5.8% | 4.4% | 2.5% |
| Core:xFE&A | |||||||
| Blue shaded area data trail by one month | |||||||
by Robert Brusca March 3, 2008
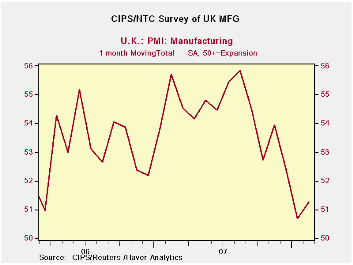
The UK MFG sector rebounded slightly in February although it remains a weak reading for the sector at 52.26. Readings above 50 indicated expansion on this measure. The MFG measure stands in the 61st percentile of its range, a moderately expansionary reading. Construction and services sector are still relatively weaker in their respective ranges but are as yet only available through January, not February.
| MFG, Construction and Services PMI CIPS/NTC | ||||||
|---|---|---|---|---|---|---|
| Monthly readings | Change over: | percentile | ||||
| Feb-08 | Jan-08 | 3MO | 6MO | 12MO | of range | |
| MFG | 51.26 | 50.69 | -2.02 | -4.75 | -3.09 | 61.8 |
| Construction | #N/A | 53.87 | -3.54 | -7.95 | -4.03 | 34.3 |
| Services* | #N/A | 52.46 | -0.62 | -4.56 | -6.76 | 35.8 |
| MFG range since January 1992; Construction Since April 1997 Services Since July 1995. | ||||||
| *Services & construction changes and ranking: Jan-08 which is the most current date. | ||||||

Tom Moeller
AuthorMore in Author Profile »Prior to joining Haver Analytics in 2000, Mr. Moeller worked as the Economist at Chancellor Capital Management from 1985 to 1999. There, he developed comprehensive economic forecasts and interpreted economic data for equity and fixed income portfolio managers. Also at Chancellor, Mr. Moeller worked as an equity analyst and was responsible for researching and rating companies in the economically sensitive automobile and housing industries for investment in Chancellor’s equity portfolio. Prior to joining Chancellor, Mr. Moeller was an Economist at Citibank from 1979 to 1984. He also analyzed pricing behavior in the metals industry for the Council on Wage and Price Stability in Washington, D.C. In 1999, Mr. Moeller received the award for most accurate forecast from the Forecasters' Club of New York. From 1990 to 1992 he was President of the New York Association for Business Economists. Mr. Moeller earned an M.B.A. in Finance from Fordham University, where he graduated in 1987. He holds a Bachelor of Arts in Economics from George Washington University.
More Economy in Brief


