 Global| Apr 01 2008
ISM Factory Sector Index Ticked Higher But Still Was Below 50
by:Tom Moeller
|in:Economy in Brief
Summary
The Institute of Supply Management (ISM) reported that in March its Composite Index of Manufacturing Sector Activity ticked up to 48.6 from 48.3 in February. The rise exceeded Consensus expectations for a decline to 47.5. However, the [...]
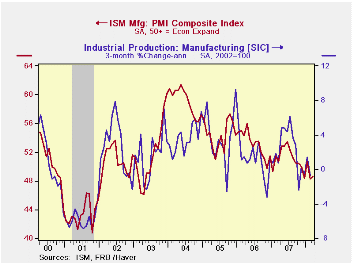
The Institute of Supply Management (ISM) reported that in March its Composite Index of Manufacturing Sector Activity ticked up to 48.6 from 48.3 in February. The rise exceeded Consensus expectations for a decline to 47.5. However, the index remained below the break even level for activity of 50 for the third month in the last four.
Last month's composite reading was down from 50.7 in January and 48.4 in December. The three month average level of 49.2 remained near its lowest since early 2003.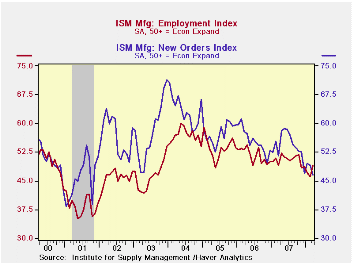
During the last twenty years there has been a 64% correlation between the level of the Composite Index and the three month growth in factory sector industrial production.
It is appropriate to correlate the ISM index level with factory sector growth because the ISM index is a diffusion index. It measures growth by being constructed using all of the absolute positive changes in activity added to one half of the no change in activity measures.
The employment index rose a sharp 3.2 points to 49.2 and made up all of the declines during the prior two months. During the last twenty years there has been a 67% correlation between the level of the ISM employment Index and the three month growth in factory sector employment. The supplier deliveries index also surged 3.5 points to its highest level since late 2006.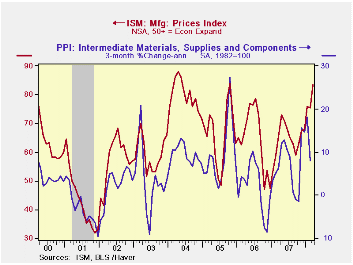
Three of the index's component series fell. The new orders index declined sharply to its lowest level since late in the recession year of 2001. Production also fell sharply to its lowest level since early 2003 and the inventory component slipped to its lowest level since last September.
The new export orders sub-series rose slightly by 0.5 points and recovered just a piece of a large 2.5 point February drop.
The prices paid index surged to its highest level since October 2005. During the last twenty years there has been a 77% correlation between the price index and the three month change in the PPI for intermediate goods.
The Economic Review 2008 from the Federal Reserve Bank of San Francisco is available here.
| ISM Mfg | March | February | March '07 | 2007 | 2006 | 2005 |
|---|---|---|---|---|---|---|
| Composite Index | 48.6 | 48.3 | 50.7 | 51.1 | 53.1 | 54.4 |
| New Orders Index | 46.5 | 49.1 | 51.5 | 54.3 | 55.4 | 57.4 |
| Employment Index | 49.2 | 46.0 | 49.2 | 50.5 | 51.7 | 53.6 |
| Prices Paid Index (NSA) | 83.5 | 75.5 | 65.5 | 64.6 | 65.0 | 66.4 |

Tom Moeller
AuthorMore in Author Profile »Prior to joining Haver Analytics in 2000, Mr. Moeller worked as the Economist at Chancellor Capital Management from 1985 to 1999. There, he developed comprehensive economic forecasts and interpreted economic data for equity and fixed income portfolio managers. Also at Chancellor, Mr. Moeller worked as an equity analyst and was responsible for researching and rating companies in the economically sensitive automobile and housing industries for investment in Chancellor’s equity portfolio. Prior to joining Chancellor, Mr. Moeller was an Economist at Citibank from 1979 to 1984. He also analyzed pricing behavior in the metals industry for the Council on Wage and Price Stability in Washington, D.C. In 1999, Mr. Moeller received the award for most accurate forecast from the Forecasters' Club of New York. From 1990 to 1992 he was President of the New York Association for Business Economists. Mr. Moeller earned an M.B.A. in Finance from Fordham University, where he graduated in 1987. He holds a Bachelor of Arts in Economics from George Washington University.
More Economy in Brief


