 Global| Jul 01 2009
ISM Factory Sector Index RoseModestly While Prices Jump
by:Tom Moeller
|in:Economy in Brief
Summary
The National Association of Purchasing Management indicated that the recession in factory sector continued to moderate last month. The June composite index for the factory sector rose to 44.8 from 42.8 in May. Though the latest figure [...]
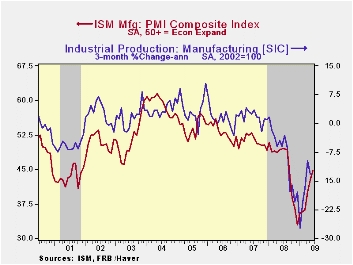
The National Association of Purchasing Management indicated that the recession in factory sector continued to moderate last month. The June composite index for the factory sector rose to 44.8 from 42.8 in May. Though the latest figure still indicates a lower level of activity, as does any below the break-even point of 50, the rate of decline appears to be easing. The worst of the decline was at yearend '08 when the index touched 32.9. The latest figure about matched Consensus expectations.
 Improvement in the components of the overall June ISM index
was broad-based. The production component pushed through the break-even
point for the first time since last summer with a rise to 52.5, up off
the low of 26.3 in December. During the last ten years there has been
an 84% correlation between the level of the production component of the
composite index and the three-month growth in factory sector industrial
production. It is appropriate to correlate the ISM index level
with factory sector output growth because the ISM
index is a diffusion index. It measures growth by using all of the
positive changes in activity added to one half of the zero change in
activity measures. The speed of supplier deliveries also
slowed for the third consecutive month.
Improvement in the components of the overall June ISM index
was broad-based. The production component pushed through the break-even
point for the first time since last summer with a rise to 52.5, up off
the low of 26.3 in December. During the last ten years there has been
an 84% correlation between the level of the production component of the
composite index and the three-month growth in factory sector industrial
production. It is appropriate to correlate the ISM index level
with factory sector output growth because the ISM
index is a diffusion index. It measures growth by using all of the
positive changes in activity added to one half of the zero change in
activity measures. The speed of supplier deliveries also
slowed for the third consecutive month.
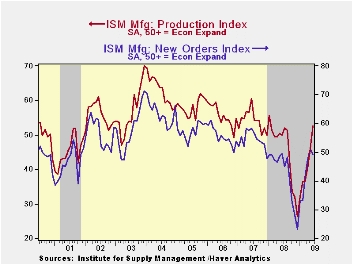
 Importantly, the employment index rose to its highest level
(40.7) since last September and it was up from the February low of
26.1. During the last ten years there has been an 89% correlation
between the index level and the one-month change in manufacturing
payrolls. The new orders figure retraced slightly its earlier
improvement with a decline to slightly below the break-even level of
50. Nevertheless, it remained near the highest level since last August
and up from the December low of 23.1. The export order index improved
further to 49.5 versus the December reading of 35.5. During the last
ten years there has been a 53% correlation between the index and the
q/q change in real exports of goods in the GDP accounts. The rate of
inventory destocking picked up as evidenced by a low reading of 30.8
which was the lowest level since 1982.
Importantly, the employment index rose to its highest level
(40.7) since last September and it was up from the February low of
26.1. During the last ten years there has been an 89% correlation
between the index level and the one-month change in manufacturing
payrolls. The new orders figure retraced slightly its earlier
improvement with a decline to slightly below the break-even level of
50. Nevertheless, it remained near the highest level since last August
and up from the December low of 23.1. The export order index improved
further to 49.5 versus the December reading of 35.5. During the last
ten years there has been a 53% correlation between the index and the
q/q change in real exports of goods in the GDP accounts. The rate of
inventory destocking picked up as evidenced by a low reading of 30.8
which was the lowest level since 1982.
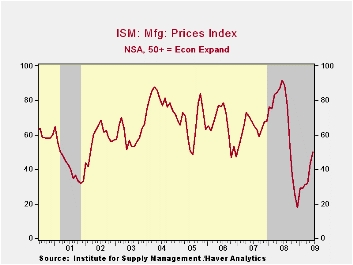
The separate index of prices paid again rose sharply with improved activity levels. The reading at the break-even level of 50 was its highest since last September and it's up from the December low of 18.0. During the last twenty years there has been a 79% correlation between the price index and the three-month change in the PPI for intermediate goods.
| ISM Mfg | June | May | June '08 | 2008 | 2007 | 2006 |
|---|---|---|---|---|---|---|
| Composite Index | 44.8 | 42.8 | 49.5 | 45.5 | 51.1 | 53.1 |
| New Orders Index | 49.2 | 51.1 | 49.3 | 42.1 | 54.3 | 55.4 |
| Employment Index | 40.7 | 34.3 | 44.1 | 43.2 | 50.5 | 51.7 |
| Prices Paid Index (NSA) | 50.0 | 43.5 | 91.5 | 66.5 | 64.6 | 65.0 |
by Tom Moeller July 1, 2009
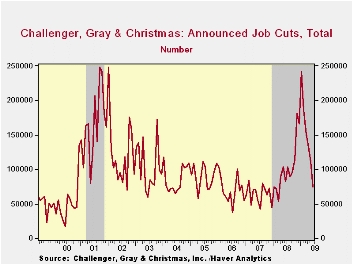
For the fifth consecutive month the outplacement firm of Challenger, Grey & Christmas indicated that job cut announcements eased. In fact, the number of layoff announcements of 74,393 was the least since March of last year. This cycle's largest layoff total occurred this past January when there were 241,749 cuts. Challenger also reported, however, that announced hiring plans remained near the cycle low.
Announcement of job cuts in the pharmaceutical industry fell even further to 515, the lowest level since early 2007. Announcements in the financial industry also fell as did cuts in the services, apparel and (sharply) in the chemical industries. Job cuts in the computer industry fell to the lowest level since December ad layoffs in the auto industry fell as well.
Picking up some steam were job cut announcements in the chemical and in the transportation industry.
During the last ten years there has been a 67% (inverse) correlation between the three month moving average of announced job cuts and the three month change payroll employment. Job cut announcements differ from layoffs. Many are achieved through attrition, early retirement or just never occur.
The Challenger figures are available in Haver's SURVEYS database.
| Challenger, Gray & Christmas | June | May | Y/Y | 2008 | 2007 | 2006 |
|---|---|---|---|---|---|---|
| Announced Job Cuts | 74,393 | 111,182 | -9.0% | 1,223,993 | 768,264 | 839,822 |
by Robert Brusca July 1, 2009
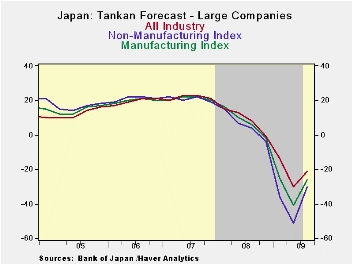
The percentile readings on the far right of the table tell the
real story. A bottom 12 percentile range result is about the strongest
reading for any component except for the outlook surveys where the
standing is a 20% to 30% result or worse for small firms. These are
still very weak numbers for Japan.
Large-, small- and medium-sized firms all show some
improvement in the quarter. For small firms the outlook mostly
deteriorated, in contrast with the other firms’ views. The closely
watched large firm survey shows MFG firms are doing better than non MFG
firms in terms the their respective range percentile readings, although
the raw readings make it seem as though the non MFG firms are doing
better. Their raw response while higher than those for MFG, sit lower
in its range that the MFG response sits in its range.
Three non MFG sectors, wholesale, retail, and transportation,
managed to improve quarter-to-quarter. MFG improved as well. The rest
worsened. It’s a poor showing despite the improvement in the quarter.
| Tankan Results Large Enterprises | |||||||
|---|---|---|---|---|---|---|---|
| Readings | Averages | PERCENTILES | |||||
| Q2-09 | Q1-09 | Q4-08 | Q3-08 | 1-Y Avg | Since Q3'03 | Since Q1'04 | |
| MFG | -48.0 | -58.0 | -24.0 | -3.0 | -53.0 | 8.2 | 11.9% |
| NonMFG | -29.0 | -31.0 | -9.0 | 1.0 | -30.0 | 9.6 | 3.8% |
| Total Industry | -39.0 | -45.0 | -16.0 | 0.0 | -42.0 | 8.8 | 8.8% |
| Construction | -29.0 | -27.0 | -10.0 | -7.0 | -28.0 | -5.4 | 0.0% |
| Real Estate | -24.0 | -21.0 | -7.0 | 5.0 | -22.5 | 25.6 | 0.0% |
| Wholesale | -41.0 | -44.0 | -7.0 | 11.0 | -42.5 | 10.7 | 4.4% |
| Retail | -39.0 | -42.0 | -18.0 | -5.0 | -40.5 | 0.7 | 5.2% |
| Transportation | -43.0 | -46.0 | -7.0 | 6.0 | -44.5 | 8.3 | 4.3% |
| Services 4 Biz | -30.0 | -21.0 | -1.0 | 4.0 | -25.5 | 17.4 | 0.0% |
| Personal Serv | -11.0 | -9.0 | -11.0 | 6.0 | -10.0 | 7.6 | 0.0% |
| Restaurants & Hotels | -46.0 | -45.0 | -32.0 | -13.0 | -45.5 | -0.8 | 0.0% |
| Forecast | |||||||
| Q3-09 | Q2-09 | Q1-09 | Q4-08 | 1-Y Avg | Since Q3'03 | Since Q1'04 | |
| MFG-OtLk | -30.0 | -51.0 | -36.0 | -4.0 | -30.3 | 7.9 | 28.8% |
| NonMFG -Otlk | -21.0 | -30.0 | -14.0 | -1.0 | -16.5 | 9.8 | 17.0% |
| All Industry-Otlk | -26.0 | -41.0 | -25.0 | -2.0 | -23.5 | 8.7 | 23.8% |
| Tankan Results Medium Enterprises | |||||||
| Q2-09 | Q1-09 | Q4-08 | 1-Y Avg | 1-Y Avg | Since Q3'03 | Since Q1'04 | |
| MFG | -55.0 | -57.0 | -24.0 | -36.0 | -36.0 | -3.7 | 2.7% |
| NonMFG | -36.0 | -37.0 | -21.0 | -26.5 | -26.5 | -6.3 | 2.2% |
| Forecast | |||||||
| Q3-09 | Q2-09 | Q1-09 | Q4-08 | 1-Y Avg | Since Q3'03 | Since Q1'04 | |
| MFG-OtLk | -46.0 | -61.0 | -45.0 | -12.0 | -41.0 | -5.7 | 20.0% |
| NonMFG -Otlk | -32.0 | -45.0 | -32.0 | -17.0 | -31.5 | -8.1 | 25.0% |
| All Industry-Otlk | -39.0 | -51.0 | -38.0 | -15.0 | -35.8 | -7.3 | 19.7% |
| Tankan Results Small Enterprises | |||||||
| Q3-09 | Q2-09 | Q1-09 | Q4-08 | 1-Y Avg | Since Q3'03 | Since Q1'04 | |
| MFG | -57.0 | -57.0 | -29.0 | -57.0 | -57.0 | -10.5 | 0.0% |
| NonMFG | -44.0 | -42.0 | -29.0 | -43.0 | -43.0 | -17.6 | 0.0% |
| Total Industry | -44.0 | -42.0 | -29.0 | -43.0 | -43.0 | -17.6 | 0.0% |
| Forecast | |||||||
| Q3-09 | Q2-09 | Q1-09 | Q4-08 | 1-Y Avg | Since Q3'03 | Since Q1'04 | |
| MFG-OtLk | -53.0 | -63.0 | -48.0 | -25.0 | -47.3 | -12.4 | 13.9% |
| NonMFG -Otlk | -45.0 | -52.0 | -42.0 | -31.0 | -42.5 | -21.6 | 15.9% |
| All Industry-Otlk | -48.0 | -56.0 | -44.0 | -29.0 | -44.3 | -18.3 | 14.8% |
by Tom Moeller July 1, 2009
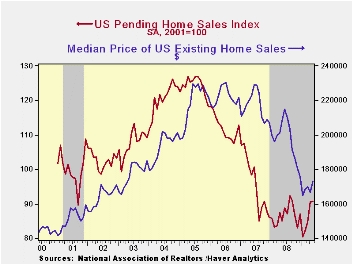
The moderate rebound in housing activity continued last month. The National Association of Realtors reported that May pending sales of existing homes held roughly stable with April at the highest level since last September. Consensus expectations had been for a slight 0.5% increase in May sales.
Last month's stability in overall home sales was reflective of gains in two of the country's regions and declines in the other two. In the Northeast sales rose slightly to the highest level since November of 2007. In the West sales recovered further from the February low. Elsewhere, sales in the Midwest fell slightly but were at their highest since mid-2007 while sales in the South fell as well m/m.
The home sales figures are analogous to the new home sales data from the Commerce Department in that they measure existing home sales when the sales contract is signed, not at the time the sale is closed. The series dates back to 2001.
The latest monthly gains in home sales have been accompanied
by some stability in home prices. The median sales price of an existing
home increased 3.8% in May (-16.8% y/y) and prices have been flat-to-up
slightly so far this year. That latest increase reduced
slightly the affordability index of a home but it nevertheless remained
up by 32.2% year-to-year and by three quarters from the 2006 low. The
latest level was near the record high for the series which extends back
to 1970.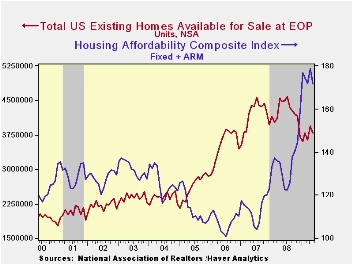
The Realtors Association indicated in an earlier report that the number of homes on the market and available for sale slipped m/m and was down 15.3% versus one year earlier. At the current sales rate there was a 9.6 months' supply of homes on the market which was near the lowest since August 2007 but still up from the 8.9 months supply during all of 2007 and 6.5 months during 2006. At the high, there was a 10.4 months supply during all of last year.
The pending home sales data are available in Haver's PREALTOR database. The number of homes on the market and prices are in the REALTOR database.
Bank Credit Standards from the Federal Reserve Bank of Philadelphia is available here.
| Pending Home Sales (2001=100) | May | April | Y/Y | 2008 | 2007 | 2006 |
|---|---|---|---|---|---|---|
| Total | 90.7 | 90.6 | 6.7% | 86.8 | 95.8 | 112.1 |
| Northeast | 80.9 | 78.5 | 6.7 | 72.6 | 85.6 | 98.5 |
| Midwest | 89.2 | 90.4 | 11.5 | 80.6 | 89.5 | 102.0 |
| South | 92.6 | 94.2 | 7.9 | 89.8 | 107.3 | 127.3 |
| West | 96.9 | 94.8 | 0.7 | 99.3 | 92.1 | 109.5 |
by Tom Moeller July 1, 2009
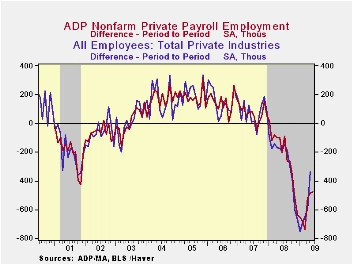 While
a turn to positive growth in employment still is not at hand, the June
report from the payroll processor ADP in their National Employment
Report again showed an easing in the rate of contraction. It indicated
that private nonfarm payrolls fell 473,000 last month after a revised
485,000 May decline that was shallower than reported initially. The
latest reading was the seventeenth consecutive monthly decline, but the
annualized rate of decline in payrolls eased somewhat to 5.2% during
the last three months from its peak of 7.1% in March.
While
a turn to positive growth in employment still is not at hand, the June
report from the payroll processor ADP in their National Employment
Report again showed an easing in the rate of contraction. It indicated
that private nonfarm payrolls fell 473,000 last month after a revised
485,000 May decline that was shallower than reported initially. The
latest reading was the seventeenth consecutive monthly decline, but the
annualized rate of decline in payrolls eased somewhat to 5.2% during
the last three months from its peak of 7.1% in March.
ADP compiled the estimate from its database of individual companies' payroll information. Macroeconomic Advisers, LLC, the St. Louis economic consulting firm, developed the methodology for transforming the raw data into an economic indicator.
 The
U.S. Bureau of Labor Statistics will report June payroll employment
tomorrow. For comparison, May's
485,000 worker decline in ADP's measure of private nonfarm payrolls was
accompanied by 338,000 job losses in the BLS measure of private sector
payrolls.According to
ADP and Macro-Advisers, the correlation between the monthly percentage
change in the ADP estimate and that in the BLS data is 0.90.
The
U.S. Bureau of Labor Statistics will report June payroll employment
tomorrow. For comparison, May's
485,000 worker decline in ADP's measure of private nonfarm payrolls was
accompanied by 338,000 job losses in the BLS measure of private sector
payrolls.According to
ADP and Macro-Advisers, the correlation between the monthly percentage
change in the ADP estimate and that in the BLS data is 0.90.
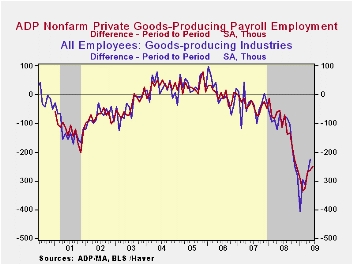
ADP reported that last month smaller medium-sized payrolls remained in forefront of monthly job loss and fell another 205,000 (-5.6% y/y) followed by a 177,000 (-4.2% y/y) worker decline in small-sized payrolls. Large payrolls fell by 91,000 (-5.5% y/y). In the goods producing sector there were 250,000 fewer jobs in June (-12.7% y/y). Details in the goods sector show that medium-sized payrolls fell 108,000 (-13.2% y/y) followed by a 90,000 (-12.0% y/y) shortfall in small-sized payrolls. Large payrolls fell 52,000 (-12.8% y/y). In the manufacturing sector alone, payrolls fell 146,000 (-12.5% y/y).
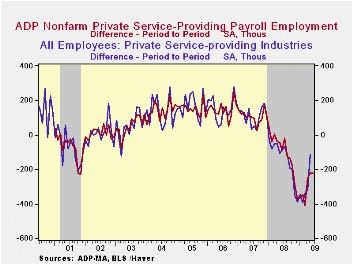 Declines in employment in
the service producing industry continued to
lag just slightly the factory sector's workforce contraction with a
223,000 (-3.1% y/y) decline, the fifteenth consecutive monthly decline.
Medium-sized service payrolls fell 97,000 (-3.5% y/y) and small-sized
payrolls dropped 87,000 (-2.7% y/y). Large service producing payrolls
dropped by 39,000 (-3.4% y/y).
Declines in employment in
the service producing industry continued to
lag just slightly the factory sector's workforce contraction with a
223,000 (-3.1% y/y) decline, the fifteenth consecutive monthly decline.
Medium-sized service payrolls fell 97,000 (-3.5% y/y) and small-sized
payrolls dropped 87,000 (-2.7% y/y). Large service producing payrolls
dropped by 39,000 (-3.4% y/y).
The ADP National Employment Report data is maintained in Haver's
USECON database; historical figures date back to December 2000. The figures in this report cover only private sector jobs and exclude employment in the public sector, which rose an average 11,083 during the last twelve months.The full ADP National Employment Report can be found here
,and the ADP methodology is explained here.| LAXEPA@USECON | June | May | Y/Y | 2008 | 2007 | 2006 |
|---|---|---|---|---|---|---|
| Nonfarm Private Payroll Employment (m/m Chg.) | -473,000 | -485,000 | -4.9% | -0.4 | 1.2% | 2.0% |
by Carol Stone July 1, 2009
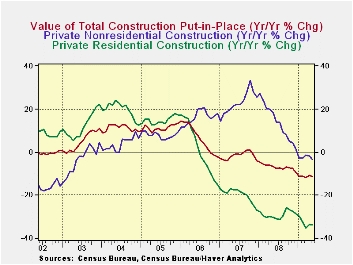
Construction outlays fell 0.9% in May, reverting to a decline after April's limp 0.6% increase. That was revised from a 0.8% rise and March was revised to a 0.4% decrease from a 0.4% increase reported last month. This report included annual revisions, which began in January 2007; the level in 2007 was revised up slightly. For 2008, several months are lower than before, but the steepness of the late-year decline was moderated, leaving recent levels basically unchanged from previous reports.
Private nonresidential building outlays remain a main support
to overall construction, with a 0.5% gain in May following 1.3% in
April. However, the historical revisions cut earlier months, and the
sector has shown year-to-year declines now since January. May was down
3.3% from a year ago.This masks divergent trends among divisions:
communications are off 28.3% from May 2008 but transportation is now up
5.9%, its first year/year increase this year after a steep drop during
the winter. Office construction, with a tiny 0.1% rise in May, may be
stabilizing after a continuous month/month contraction since last
September; year-on-year, it is off 18.2%. The most traditional forms of
private nonresidential construction, power plants and manufacturing
facilities, are expanding, with power up 12.0% from a year ago and
manufacturing a strong 55.6%. 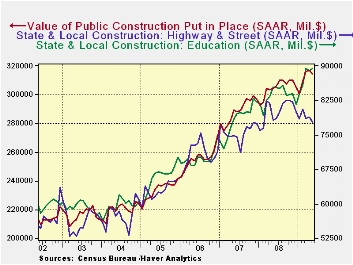
Residential building activity continues weak. It fell 3.4% month-to-month in May and April's previously reported 0.7% increase was revised to a 0.3% cut. Year-on-year, it is off 33.9%. The best we can say is that this last figure is a bit less severe than April's initially reported 35% drop. Single-family home construction is down 54.1% y/y, although May's monthly performance was down "just" 4.5%, the smallest decline since last August.
Public construction edged down in May by 0.6%, while April's previously reported 0.6% decrease was revised to a 0.2% rise and March's 1.0% increase is now calculated at 2.2%. Year-on-year, public sector activity is up 3.4%, little different from the prior report of 3.3%. By type, spending on highways and streets is ratcheting lower, with May down 1.3% from April and 0.5% from May 2008. Education, the other big category, has, by contrast, been gaining in most months so far this year; May was up 0.4% on the month and 4.7% on the year. School-building has, with occasional interruption, sustained an uptrend through much of the last five or six years.
The construction put-in-place figures are available in Haver's USECON database.
| Construction (%) | May | April | March | Y/Y | 2008 | 2007 | 2006 |
|---|---|---|---|---|---|---|---|
| Total | -0.9 | 0.6 | -0.4 | -11.6 | -6.9 | -1.6 | 6.3 |
| Private | -1.0 | 0.8 | -1.6 | -17.4 | -11.1 | -5.7 | 5.5 |
| Residential | -3.4 | -0.3 | -4.6 | -33.9 | -29.1 | -19.7 | 1.0 |
| Nonresidential | 0.5 | 0.2 | 0.4 | -3.3 | 13.2 | 23.1 | 16.2 |
| Public | -0.6 | -0.6 | 2.2 | 3.4 | 5.6 | 13.1 | 9.3 |

Tom Moeller
AuthorMore in Author Profile »Prior to joining Haver Analytics in 2000, Mr. Moeller worked as the Economist at Chancellor Capital Management from 1985 to 1999. There, he developed comprehensive economic forecasts and interpreted economic data for equity and fixed income portfolio managers. Also at Chancellor, Mr. Moeller worked as an equity analyst and was responsible for researching and rating companies in the economically sensitive automobile and housing industries for investment in Chancellor’s equity portfolio. Prior to joining Chancellor, Mr. Moeller was an Economist at Citibank from 1979 to 1984. He also analyzed pricing behavior in the metals industry for the Council on Wage and Price Stability in Washington, D.C. In 1999, Mr. Moeller received the award for most accurate forecast from the Forecasters' Club of New York. From 1990 to 1992 he was President of the New York Association for Business Economists. Mr. Moeller earned an M.B.A. in Finance from Fordham University, where he graduated in 1987. He holds a Bachelor of Arts in Economics from George Washington University.
More Economy in Brief


