 Global| Jun 02 2008
ISM Factory Sector Index Rose Unexpectedly; Level Still Indicates Contraction
by:Tom Moeller
|in:Economy in Brief
Summary
The Institute of Supply Management (ISM) reported that during May its Composite Index of Manufacturing Sector Activity rose to 49.6 from an unrevised 48.6 in April. The latest was better than Consensus expectations which had been for [...]
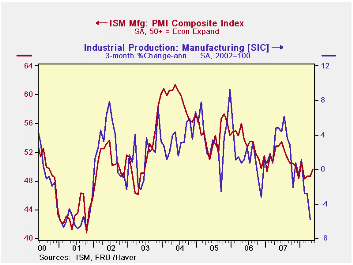
The Institute of Supply Management (ISM) reported that during May its Composite Index of Manufacturing Sector Activity rose to 49.6 from an unrevised 48.6 in April. The latest was better than Consensus expectations which had been for an unchanged reading m/m. However, the index remained below the break even level for factory sector activity of 50 for the fifth month in the last six.
The index's average level of 49.0 so far this year was its
lowest since early 2003.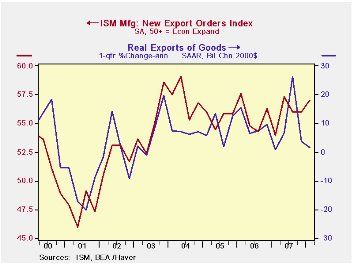
During the last twenty years there has been a 64% correlation between the level of the Composite Index and the three-month growth in factory sector industrial production.
It is appropriate to correlate the ISM index level with factory sector growth because the ISM index is a diffusion index. It measures growth by using all of the positive changes in activity added to one half of the zero change in activity measures.
The new orders index rose slightly m/m to its highest level
since November of last year. The reading was, however, near the lowest
level since the recession year of 2001. The production index also rose
very modestly for the second month. The inventory component and the
supplier delivery indexes were roughly unchanged month-to-month.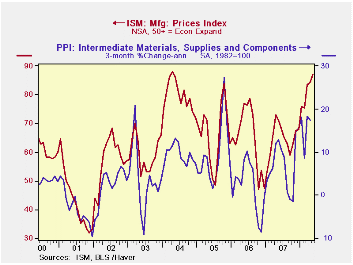
The new export orders sub-series rose moderately to 59.5 which was its highest level since early 2004. During the last ten years there has been a 53% correlation between the index and the q/q change in real exports of goods in the GDP accounts.
The employment index was about unchanged at the low reading of 45.5, near its lowest level since mid 2003. During the last twenty years there has been a 67% correlation between the level of the ISM employment index and the three-month growth in factory sector employment.
The prices paid index rose again to its highest level since early 2004. During the last twenty years there has been a 77% correlation between the price index and the three-month change in the PPI for intermediate goods.
The NBER's Business-Cycle Dating Procedure is available here.
| ISM Mfg | May | April | May '07 | 2007 | 2006 | 2005 |
|---|---|---|---|---|---|---|
| Composite Index | 49.6 | 48.6 | 52.8 | 51.1 | 53.1 | 54.4 |
| New Orders Index | 49.7 | 46.5 | 58.6 | 54.3 | 55.4 | 57.4 |
| Employment Index | 45.5 | 45.4 | 51.4 | 50.5 | 51.7 | 53.6 |
| Prices Paid Index (NSA) | 87.0 | 84.5 | 71.0 | 64.6 | 65.0 | 66.4 |
by Tom Moeller June 2, 2008
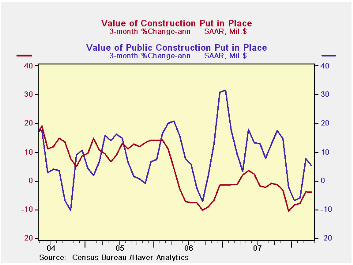
The value of construction put in place fell for the seventh consecutive month in April. The 0.4% decline was about as-expected and the March decline of 0.6% was half that reported initially. Nevertheless, the value of total construction was down 8.6% since its peak in early 2006.
A 2.3% decline in the April value of residential building activity led last month's decline in the total, and since its peak it has fallen by more than one-third. The 37.4% decline was paced by lower building of single family units; down 4.4% in April and by 3.0% to 5.4% in each of the prior eight months. Building activity on multi-family units increased 0.4% (-12.5% y/y) for the second straight month while spending on improvements fell 0.5% (+7.5% y/y).
During the last twenty years there has been an 84% correlation between the q/q change in the value of residential building and its contribution to growth in real GDP.
The value of nonresidential building activity surged again for
the third straight month. The 1.6% increase was led by a 7.6% (45.4%
y/y) jump in lodging and a 1.0% (19.4% y/y) increase in the education
category. Growth in office building remained firm though it posted only
a 0.5% (15.0% y/y) increase during April. Growth in multi-retail
building eased. A 2.1% gain during April failed to make up the declines
during the prior few months and spending was down 4.1% y/y.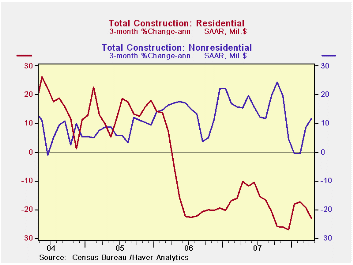
Public construction slipped 0.3% after a 1.0% March surge. Public sector nonresidential building slipped 0.5% but it still was up 7.0% y/y. The value of construction spending on highways & streets ticked up 0.1% (5.2% y/y) after strong gains during the prior two months. (The value of construction on highways & streets is roughly one third of the value of total public construction spending.) Building activity of educational facilities rose 7.3% from a year earlier and nonresidential office building surged 26.4% y/y.
The more detailed categories of construction represent the Census Bureau’s reclassification of construction activity into end-use groups. Finer detail is available for many of the categories; for instance, commercial construction is shown for automotive sales and parking facilities, drugstores, building supply stores, and both commercial warehouses and mini-storage facilities. Note that start dates vary for some seasonally adjusted line items in 2000 and 2002 and that constant-dollar data are no longer computed.
| Construction | April | March | Y/Y | 2007 | 2006 | 2005 |
|---|---|---|---|---|---|---|
| Total | -0.4% | -0.6% | -3.9% | -2.7% | 5.6% | 10.7% |
| Private | -0.5% | -1.1% | -7.2% | -6.8% | 4.7% | 12.0% |
| Residential | -2.3% | -3.0% | -21.0% | -18.1% | 0.5% | 13.7% |
| Nonresidential | 1.6% | 1.2% | 15.4% | 18.0% | 15.2% | 7.8% |
| Public | -0.3% | 1.0% | 6.8% | 12.2% | 9.2% | 6.2% |
by Robert Brusca June 2, 2008
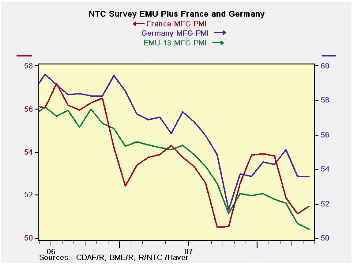
Manufacturing output weakened slightly in the Euro Area in May but the pace of decline is slowing. Among reporting countries the MFG PMIs mostly slipped in May. France and the Netherlands were exceptions, the Netherlands in the most trivial of ways.
Spain remains the mostly serious impacted of EMU countries with its MFG PMI in the bottom 2.5% of range constructed from early 2000 on. The overall EMU PMI is below breakeven at the 43.7 range percentile. France, Italy and Austria, too, are below their respective range midpoints. Germany’s standing at the 61.2 percentile of its range is astonishing. The UK, an EU only member, stands in the 42 percentile of its range.
For the most part these rankings reflect inflation rankings and therefore reflect competitiveness rankings within the EMU area. Greece, however, is performing in terms of its MFG PMI much better than its inflation ranking would have you believe it would. The rest fall more or less into line. (see inflation chart below for cumulative inflation on the national HICPs since July 2000).
The table shows that German inflation has risen by 4.4 percentage points less than EMU inflation during their period. Greece’s HICP has risen by 11.5% more than the EMU average. Spain is also an inflation leader and as expected it is an output laggard in this cycle as the euro has risen.>
On balance there is a great deal of irregularity within the
Euro Area involving inflation performance and output results. Still
there is only one monetary policy, making things difficult. The ECB is
looking only at group inflation (EMU-wide) to make policy and holding
to a firm path. Cracks in the Euro Area are beginning to form.
| NTC MFG Indices | |||||||
|---|---|---|---|---|---|---|---|
| May-08 | Apr-08 | Mar-08 | 3Mo | 6Mo | 12Mo | Percentile | |
| Euro-13 | 50.60 | 50.74 | 52.03 | 51.12 | 51.84 | 52.78 | 43.7% |
| Germany | 53.57 | 53.62 | 55.14 | 54.11 | 54.11 | 54.58 | 61.2% |
| France | 51.48 | 51.12 | 51.88 | 51.49 | 52.68 | 52.44 | 41.5% |
| Italy | 48.05 | 48.24 | 49.41 | 48.57 | 49.65 | 51.16 | 29.5% |
| Spain | 43.79 | 45.19 | 46.42 | 45.13 | 46.90 | 49.41 | 2.5% |
| Austria | 49.76 | 49.83 | 53.39 | 50.99 | 52.11 | 53.14 | 41.4% |
| Greece | 53.77 | 54.38 | 52.73 | 53.63 | 52.89 | 53.48 | 52.7% |
| Netherlands | 51.46 | 51.45 | 53.15 | 52.02 | 52.58 | 54.64 | 51.7% |
| EU | |||||||
| UK | 50.03 | 50.81 | 51.14 | 50.66 | 51.02 | 52.76 | 42.1% |
| Percentile is over range since March 2000 | |||||||
| Trouble in the Zone? | ||
|---|---|---|
| Jul-00 | Gap | |
| HICP | Apr-08 | W/EMU |
| Austria | 17.1% | -2.4% |
| France | 17.7% | -1.8% |
| Germany | 15.1% | -4.4% |
| Greece | 31.0% | 11.5% |
| Italy | 20.8% | 1.3% |
| The Netherlands | 20.3% | 0.8% |
| Spain | 28.3% | 8.8% |
| EMU Total | 19.5% | |
by Louise Curley June 2, 2008
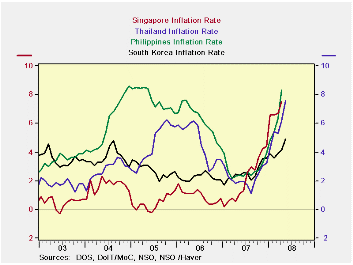
Inflation has risen sharply in most of the Far Eastern countries. Even those countries that had inflation rates below 3% in 2007--Singapore, Thailand, the Philippines and South Korea-- are now showing rates of inflation ranging from 4.9% to 8.35% in recent months. The first chart shows inflation rates in these four countries. Only in Malaysia, where inflation was 2.0% in 2007, is inflation still below 3.0%.
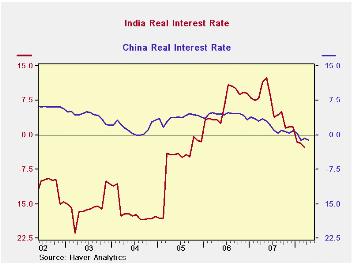
In April, China's inflation rate was 8.5% and in India, where the latest data are for March, the inflation rate was 6.0%. In other countries inflation rates are much higher. For example, in May, the inflation rates in Indonesia was 10.4% and in Vietnam, 25.3%.
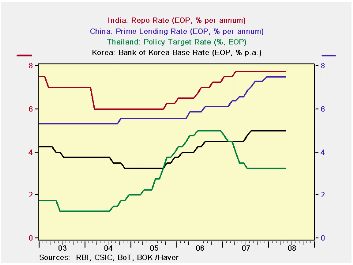
In most Far Eastern countries the monetary authorities have kept interest rates steady in recent months so that most countries now have negative real interest rates. The second chart show some typical policy interest rates and the third chart shows real interest rates in China and India, which have recently become negative.
| INFLATION RATES IN THE FAR EAST (%) | May 08 | Apr 08 | Mar 08 | Feb 08 | Jan 08 | 2007 | 2006 | 2005 |
|---|---|---|---|---|---|---|---|---|
| China | -- | 8.49 | 8.29 | 8.84 | 4.10 | 4.79 | 1.76 | 1.78 |
| India | -- | -- | 6.02 | 5.23 | 4.84 | 4.79 | 1.76 | 1.78 |
| South Korea | 4.88 | 4.11 | 3.91 | 3.57 | 3.89 | 2.53 | 2.24 | 2.75 |
| Malaysia | -- | 3.05 | 2.76 | 2.66 | 2.28 | 2.03 | 3.61 | 3.05 |
| Thailand | 7.59 | 6.19 | 5.29 | 5.41 | 4.26 | 2.23 | 4.64 | 4.54 |
| Singapore | -- | 7.54 | 6.69 | 6.58 | 6.51 | 2.10 | 0.96 | 0.47 |
| Philippines | -- | 8.29 | 6.37 | 5.36 | 4.86 | 2.77 | 6.23 | 7.68 |
| Indonesia | 10.38 | 8.96 | 8.17 | 7.90 | 7.36 | 6.41 | 13.10 | 10.46 |
| Vietnam | 25.27 | 21.43 | 19.39 | 15.67 | 14.09 | 8.30 | 7.39 | 8.28 |
| Malaysia |

Tom Moeller
AuthorMore in Author Profile »Prior to joining Haver Analytics in 2000, Mr. Moeller worked as the Economist at Chancellor Capital Management from 1985 to 1999. There, he developed comprehensive economic forecasts and interpreted economic data for equity and fixed income portfolio managers. Also at Chancellor, Mr. Moeller worked as an equity analyst and was responsible for researching and rating companies in the economically sensitive automobile and housing industries for investment in Chancellor’s equity portfolio. Prior to joining Chancellor, Mr. Moeller was an Economist at Citibank from 1979 to 1984. He also analyzed pricing behavior in the metals industry for the Council on Wage and Price Stability in Washington, D.C. In 1999, Mr. Moeller received the award for most accurate forecast from the Forecasters' Club of New York. From 1990 to 1992 he was President of the New York Association for Business Economists. Mr. Moeller earned an M.B.A. in Finance from Fordham University, where he graduated in 1987. He holds a Bachelor of Arts in Economics from George Washington University.
More Economy in Brief


