 Global| Sep 02 2003
ISM Factory Index Powered by Output & Orders
by:Tom Moeller
|in:Economy in Brief
Summary
The Purchasing Managers Composite Index (PMI) released by the Institute of Supply Managements rose in August by nearly three points to 54.7, the highest level since December. Consensus expectations had been for a more moderate rise [...]
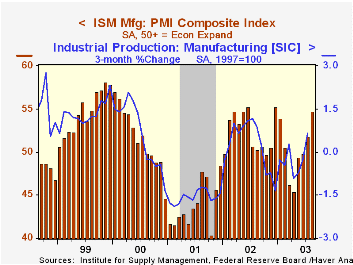
The Purchasing Managers’ Composite Index (PMI) released by the Institute of Supply Management’s rose in August by nearly three points to 54.7, the highest level since December. Consensus expectations had been for a more moderate rise to 53.5.
Production surged with the index rising to 61.6, the highest level since June 1999. New orders also surged to the highest level since January.
Again, a notable laggard was the employment index which fell slightly to 45.9. This index has not been above 50, the dividing line between rising and falling activity, since September 2000. The low for the employment index was 35.3 in October 2001. There has been a 68% correlation during the last ten years between the ISM employment index and the one-month change in factory sector payrolls.
The prices paid index was unchanged last month at 53.0. The price index has improved from the deflationary levels of late-2001 but it's current level does not suggest much pending inflationary pressure.
| ISM Manufacturing Survey | Aug | July | Aug '02 | 2002 | 2001 | 2000 |
|---|---|---|---|---|---|---|
| Composite Index | 54.7 | 51.8 | 50.3 | 52.4 | 44.0 | 51.7 |
| New Orders Index | 59.6 | 56.6 | 49.6 | 56.7 | 46.2 | 52.0 |
| Prices Paid Index (NSA) | 53.0 | 53.0 | 63.0 | 57.6 | 42.9 | 64.8 |
by Tom Moeller September 2, 2003
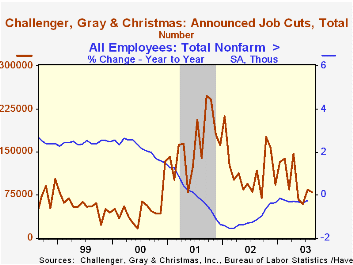
According to Challenger, Gray & Christmas, announced job cuts fell last month following a sharp m/m jump in July. Layoff announcements fell 6.1% in August versus July.
The three month moving average of job cut announcements ticked up slightly but was down by nearly 50% from a recent high late last year. The three month average is down more than two-thirds from the recession high in late-2001.
Job cut announcements differ from layoffs in that many are achieved through attrition or just never occur.
During the last nine years there has been a 71% correlation between the y/y change in announced job cuts and the y/y percent change in initial claims for jobless insurance. Like initial claims, job cut announcements indicate little about new hiring activity.
Job cut announcements were mixed m/m across industries.
| Challenger, Gray & Christmas | Aug | July | Y/Y | 2002 | 2001 |
|---|---|---|---|---|---|
| Announced Job Cuts | 79,925 | 85,117 | -32.3% | 1,431,052 | 1,956,876 |

Tom Moeller
AuthorMore in Author Profile »Prior to joining Haver Analytics in 2000, Mr. Moeller worked as the Economist at Chancellor Capital Management from 1985 to 1999. There, he developed comprehensive economic forecasts and interpreted economic data for equity and fixed income portfolio managers. Also at Chancellor, Mr. Moeller worked as an equity analyst and was responsible for researching and rating companies in the economically sensitive automobile and housing industries for investment in Chancellor’s equity portfolio. Prior to joining Chancellor, Mr. Moeller was an Economist at Citibank from 1979 to 1984. He also analyzed pricing behavior in the metals industry for the Council on Wage and Price Stability in Washington, D.C. In 1999, Mr. Moeller received the award for most accurate forecast from the Forecasters' Club of New York. From 1990 to 1992 he was President of the New York Association for Business Economists. Mr. Moeller earned an M.B.A. in Finance from Fordham University, where he graduated in 1987. He holds a Bachelor of Arts in Economics from George Washington University.
More Economy in Brief


