 Global| Dec 18 2012
Ireland's GDP Advances in the Third Quarter
Summary
Ireland continues to recover from the recession of 2008. According to data released today, GDP in Ireland rose a modest 0.18% in the third quarter from the second quarter and was 0.79% above GDP of a year ago. Ever since the third [...]
Ireland continues to recover from the recession of 2008. According to data released today, GDP in Ireland rose a modest 0.18% in the third quarter from the second quarter and was 0.79% above GDP of a year ago. Ever since the third quarter of 2010, Ireland's Gross Domestic Product has exceeded that of the GDP of the previous year and since the first quarter of 2011 it has exceeded the changes in real GDP of Portugal, Greece and Spain, as can be seen in the first chart.
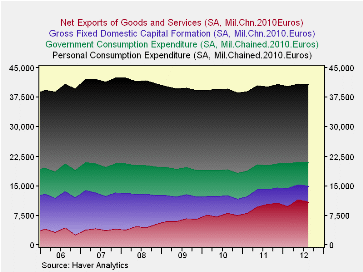
The major components of GDP are shown in the second chart and in the table below. Over the recovery period, the portions of personal and government consumption have shown little trend and that of gross fixed capital formation has declined steadily. Austerity programs--higher taxes and cuts in social programs have kept consumption and investment in check. Net exports of goods and services have been the main provider of growth. As a result, the economic outlook is likely to be dependent on continued growth in Ireland's trading partners. The International Monetary Fund estimates growth this year at 0.4%, 1.1% in 2013, and 2.2% in 2014.


