 Global| Oct 11 2011
IP Trends Slower, Then 'Catches'
Summary
IP trends in the EMU areas have been losing momentum for some time. Their peak rates of growth date back to early 2010. Since then the pace of erosion has been uneven across countries and that continues to be the case. But as IP [...]
 IP trends in the EMU areas have been losing momentum for some time. Their peak rates of growth date back to early 2010.
Since then the pace of erosion has been uneven across countries and that continues to be the case.
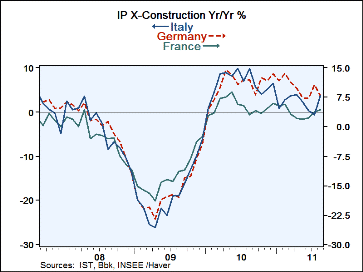
But as IP growth rates approach the Rubicon of zero and begin to flirt with contraction instead of just ‘slower’ a bit of stickiness seems to have set in. The Yr/Yr growth rate in the chart shows a sense of output catching or rebounding when the index begins to get to the no-growth boundary of zero. It’s as though IP is refusing to give in to the notion of contraction.
In the table the shorter growth rate calculations from 3-mo to 6-mo to 12-mo show few outright declines, only seven drops are posted out of a possibility of fifty-six in the three-period growth rate matrix in the table above. Only the UK and Spain show steadily declining rates of growth on ever shorter horizons culminating in negative growth rates over the most recent three-months.
But of the eight countries, four have three-month growth rates that are higher than their respective 12-months growth rates, contravening the notion of a slowdown. Still, the exceptions are odd, Greece, Ireland, Portugal and Italy. This is hardly the group that we look to for the revival of European growth.
In the quarter-to-date calculations Only Spin is showing an outright decline in output but Greece and Portugal are showing zero rates of growth. Obviously there are many cross currents in these IP trends for Europe.
We do not see the emerging trends as definitive but they are highly suggestive and despite the cross currents and rogue tides it is clear that, broadly construed, growth is slowing. It is also clear that Europe still has a lot of slack. Europe is not being slowed by having hit the wall of economic constraint. It has hit the wall of financial constraint, uncertainty and turmoil. Germany and Ireland have managed to best return and cling to their pre-recession levels of output. Both Germany and Ireland have IP at 98% of their respective pre-cycle peaks. France and Portugal have clung to around the 90% mark, falling 10% shy of their past cycle peaks; the UK is a bit better than that, off from its past peak by only 8%. Italy, Spain and Greece fall shorter still with Italy’s output at only 84% of its cycle peak, Spain at 77% and Greece at 75%.
Europe is not suffering from any bottle-neck effects. Spain’s construction sector slump has hit IP hard. In Greece it is the desperately stringent austerity program that bites. But several of the weak countries have posted some near terms spurts in output.
That is the paradox. Europe still has considerable economic abilities and potentials. These are being undermined by its financial crisis. In the end a financial crisis can undercut even a healthy industrial structure. European leaders need to be aware of this. Agreeing on what to do so the economy can shake off its pall of despair and move ahead by sorting out the winners and the losers is very important. By trying to deny that there are losers and arguing about loss-sharing the net enfolding the losers gets larger and trips up even those that might have avoided it.
European IP trends are showing some resiliency. And in the US the prospect of recession is again at our doorstep. Some say a new recession is baked in the cake; others say that the risks are much higher but the freshest economic data seem to point to an incipient revival. As in Europe the question is whether policy will nurture this new spark of growth or snuff it out? You may not be Keynesian and believe in the government’s ability to restart a faltering economy, but there are few economics who do not believe that government at least has the power to do things that stop an expansion in tracks. Let’s hope that is not the path we are choosing on either side of the pond.
| Selected Euro-Area Countries and UK IP in MFG | |||||||
|---|---|---|---|---|---|---|---|
| Mo/Mo | 3-Mo | 6-Mo | 12-Mo | Aug-11 | |||
| MFG Only | Aug-11 | Jul-11 | Jun-11 | Aug-11 | Aug-11 | Aug-11 | Q:2-Date |
| Germany: MFG | -1.0% | 4.3% | -1.2% | 8.2% | 10.1% | 9.4% | 17.7% |
| France | 0.5% | 1.8% | -1.5% | 3.4% | 2.6% | 4.4% | 8.7% |
| Italy: MFG | 4.0% | -0.4% | -0.3% | 13.5% | 8.9% | 3.6% | 5.4% |
| Spain | 3.3% | -1.0% | -3.3% | -4.2% | -3.5% | -2.3% | -3.3% |
| Ireland | 4.4% | 1.5% | -1.5% | 18.7% | 9.1% | 10.4% | 0.7% |
| Greece | -3.2% | 10.0% | -4.6% | 6.4% | -7.7% | -11.9% | 0.0% |
| Porttugal | 8.2% | -2.9% | -3.1% | 7.5% | 3.7% | -0.5% | 0.0% |
| UK: MFG | -0.3% | -0.2% | -0.1% | -2.5% | 0.4% | 1.5% | 0.7% |
| Mo/Mo are simple percent changes others are at SAARs;IPX-construction unless noted | |||||||
Robert Brusca
AuthorMore in Author Profile »Robert A. Brusca is Chief Economist of Fact and Opinion Economics, a consulting firm he founded in Manhattan. He has been an economist on Wall Street for over 25 years. He has visited central banking and large institutional clients in over 30 countries in his career as an economist. Mr. Brusca was a Divisional Research Chief at the Federal Reserve Bank of NY (Chief of the International Financial markets Division), a Fed Watcher at Irving Trust and Chief Economist at Nikko Securities International. He is widely quoted and appears in various media. Mr. Brusca holds an MA and Ph.D. in economics from Michigan State University and a BA in Economics from the University of Michigan. His research pursues his strong interests in non aligned policy economics as well as international economics. FAO Economics’ research targets investors to assist them in making better investment decisions in stocks, bonds and in a variety of international assets. The company does not manage money and has no conflicts in giving economic advice.


