 Global| Sep 16 2009
IP Trend Turns Higher
Summary
Output and capacity: IP rose by 0.8% in August and manufacturing capacity rose for the second month in a row. For MFG, utilized capacity is just at 66.6% barely two thirds of the capacity put in place. However, even going back to the [...]
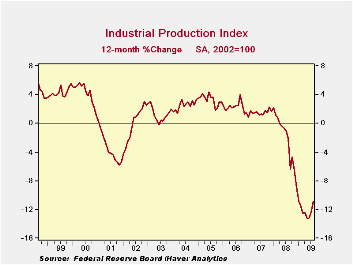
Output and capacity: IP rose by 0.8% in August and
manufacturing capacity rose for the second month in a row. For MFG,
utilized capacity is just at 66.6% barely two thirds of the capacity
put in place. However, even going back to the overheated sixties when
capacity use rates were higher, capacity utilization has never
triggered a reading above 91.6. Still, it’s a lot of capacity that is
left unused and the economy is not exactly scooping up the excess at a
rapid rate. Manufacturing capacity use rose from 65.1 in June to 66.1
in July and to 66.6 in August.
Manufacturing: Manufacturing output rose by 0.6% in August
lead by a 0.7% gain in nondurable goods. But durable good output rose
by 0.4% and that was on top of a gain of 1.4% the month before that,
implying a bit more momentum.
By sector: Consumer goods output rose, led by the output
automobiles and products. Business equipment output rose led by the key
transportation sector. Materials output rose led by output in the
energy sector, although nondurables goods ex-energy output also moved
up strongly in the month. Consumer goods business equipment and
materials output all are up for two months running.
Caution about the impact of this strong growth on GDP: In the
quarter to date, with two of three-month’s data in place, industrial
output is up at a 3.4% pace and MFG output is up at a strong 5.7% pace.
While these are strong numbers let me caution you that IP figures do
not easily translate into GDP growth. You have treat the IP report as
if it is an ‘indicator.’ We measure GDP in the United States from the
expenditure side not from the output side and so the IP report per se
does not feed into GDP. One clear issue is that the IP report uses
different seasonal factors and they are real different for the auto
sector. Still, taken and an indicator, the fact that IP is growing at a
3.4% annual rate and MFG at a 5.7% annual rate suggests that there is a
lot of life to GDP. We would expect to find this output either sold to
US consumers, bought by US businesses, sold overseas as exports or
sitting on shelves as inventories (…although inventory data are so weak
that the last option seems less likely and is more there for the sake
of completing the taxonomy of options). So while that accounting is
correct what GDP finds may be different from what IP implies.
What’s still weak? What is still weak in the third quarter is
consumer goods output excluding autos as that metric has output falling
at a 4.2% pace in Q3; the output of consumer energy goods also is
falling at a pace of 12.3% in Q3. In the business sector, the output of
computers and office equipment is falling in Q3 and in the materials
sector, the output of energy products is falling.
But by and large the strength in the industrial sector is
impressive and its momentum into Q3 appears to be quite solid.
| Industrial Production | |||||||
|---|---|---|---|---|---|---|---|
| Monthly Pct. Changes | At Annual Rates of Change | SAAR | |||||
| Month-to-month Pct. Change | 3-Month | 6-Month | Year/Year | 09-Q3 | |||
| Industrial Output | Aug-09 | Jun-09 | Jul-09 | %Change | %Change | %Change | Pct Change |
| All Production & Materials | 0.7% | 0.9% | -0.9% | 2.9% | -3.8% | -10.8% | 3.4% |
| All Products | 0.8% | 0.8% | -0.8% | 3.3% | -3.6% | -8.9% | 3.2% |
| Final Products | 1.1% | 0.9% | -0.9% | 4.4% | -3.3% | -7.3% | 3.7% |
| Manufacturing only | |||||||
| MFG | 0.6% | 1.4% | -1.4% | 2.5% | -2.9% | -12.2% | 5.7% |
| MFG-Durables | 0.4% | 3.2% | -3.1% | 1.7% | -4.7% | -17.7% | 11.0% |
| MFG-Nondurables | 0.7% | -0.1% | 0.1% | 2.9% | -0.2% | -6.2% | 1.4% |
| Consumer Goods | 1.3% | 0.7% | -0.7% | 5.4% | -0.6% | -4.2% | 4.1% |
| Durables | 2.0% | 7.8% | -7.3% | 8.1% | 10.8% | -13.0% | 38.4% |
| Automotive Products | 5.8% | 17.2% | -14.7% | 23.3% | 38.0% | -8.1% | 113.6% |
| Excl Automotive Products | -1.3% | 0.6% | -0.6% | -5.3% | -10.0% | -17.3% | -4.2% |
| Nondurables | 1.2% | -0.8% | 0.8% | 4.7% | -3.0% | -1.9% | -2.4% |
| Nonenergy | 1.2% | -0.4% | 0.4% | 4.7% | -1.0% | -2.8% | 0.8% |
| Consumer Energy | 0.9% | -2.0% | 2.0% | 3.4% | -9.5% | -0.4% | -12.3% |
| Business Equipment | 0.6% | 1.0% | -1.0% | 2.2% | -10.6% | -14.7% | 1.4% |
| Transportation | 2.4% | 4.4% | -4.2% | 9.4% | -5.7% | -15.4% | 20.7% |
| Computer & Office Equipment | -1.2% | -1.2% | 1.2% | -4.7% | -19.6% | -23.8% | -16.3% |
| Excl Technology Transport | 0.4% | 0.5% | -0.5% | 1.6% | -13.0% | -14.2% | -2.2% |
| Materials | 0.5% | 1.3% | -1.3% | 2.1% | -4.3% | -13.1% | 4.0% |
| Durables | 0.0% | 3.5% | -3.3% | 0.0% | -9.1% | -23.8% | 9.3% |
| Nondurables excl Energy | 0.8% | 0.2% | -0.2% | 3.0% | 3.7% | -8.7% | 5.6% |
| Energy | 1.1% | -0.2% | 0.2% | 4.5% | -6.3% | -4.8% | -3.0% |
| Actual Auto Production Levels | |||||||
| Month-to-month Pct. Change | 3-Month | 6-Month | Year/Year | 09-Q3 | |||
| Vehicle Production | Aug-09 | Jun-09 | Jul-09 | %Change | %Change | %Change | Pct Change |
| Autos | 55.9% | -7.0% | 7.5% | 223.6% | 111.1% | -31.4% | 164.0% |
| Trucks | 37.1% | 10.9% | -9.8% | 148.5% | 47.0% | -8.1% | 121.8% |

Robert Brusca
AuthorMore in Author Profile »Robert A. Brusca is Chief Economist of Fact and Opinion Economics, a consulting firm he founded in Manhattan. He has been an economist on Wall Street for over 25 years. He has visited central banking and large institutional clients in over 30 countries in his career as an economist. Mr. Brusca was a Divisional Research Chief at the Federal Reserve Bank of NY (Chief of the International Financial markets Division), a Fed Watcher at Irving Trust and Chief Economist at Nikko Securities International. He is widely quoted and appears in various media. Mr. Brusca holds an MA and Ph.D. in economics from Michigan State University and a BA in Economics from the University of Michigan. His research pursues his strong interests in non aligned policy economics as well as international economics. FAO Economics’ research targets investors to assist them in making better investment decisions in stocks, bonds and in a variety of international assets. The company does not manage money and has no conflicts in giving economic advice.
More Economy in Brief


