 Global| Jul 13 2006
Initial Unemployment Insurance Claims Increased
by:Tom Moeller
|in:Economy in Brief
Summary
Initial claims for unemployment insurance jumped 19,000 to 332,000 last week after an unrevised 2,000 slip during the prior week. Consensus expectations had been for a lesser gain to 320,000 claims. The Labor Department indicated that [...]
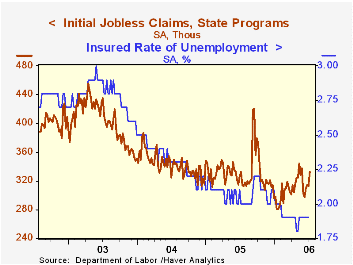
Initial claims for unemployment insurance jumped 19,000 to 332,000 last week after an unrevised 2,000 slip during the prior week. Consensus expectations had been for a lesser gain to 320,000 claims.
The Labor Department indicated that the increase reflected the annual July automobile industry plant closings for model changeover as well as 4,000 unadjusted new claims caused by a partial shutdown of the New Jersey state government. It furloughed 45,000 state workers but the shutdown over a missed budget deadline has since been resolved.
The four-week moving average of initial claims rose to 317,250 (-2.0% y/y).
Continuing claims for unemployment insurance fell 18,000 following a slightly revised 45,000 increase the previous week.
The insured rate of unemployment was stable at 1.9% where it has been since February.
Employment growth, job creation, and job destruction in Ohio from the Federal Reserve Bank of Cleveland can be found here.
| Unemployment Insurance (000s) | 07/08/06 | 07/01/06 | Y/Y | 2005 | 2004 | 2003 |
|---|---|---|---|---|---|---|
| Initial Claims | 332 | 313 | 0.0% | 332 | 343 | 403 |
| Continuing Claims | -- | 2,429 | -7.3% | 2,663 | 2,923 | 3,530 |
by Tom Moeller July 13, 2006
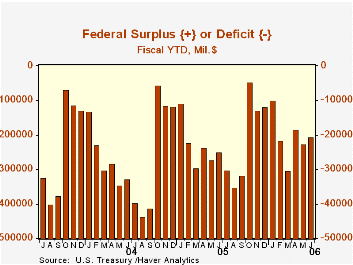
The U.S. federal government ran a budget surplus in June, as it usually does. The as expected figure of $20.5B narrowed the FY06 to-date budget deficit to $206.5B versus a deficit of $249.4B during the first nine months of FY05.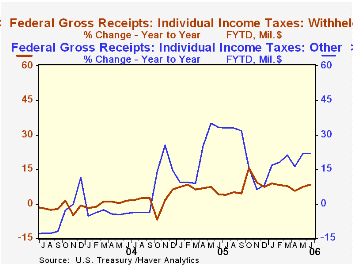
Growth in '06 net revenues FYTD versus the first nine months of FY05 remained strong at 12.8%. Individual income tax receipts (44% of total receipts) rose 14.5% FYTD as withheld taxes rose 8.4% due to improved job markets and non-withheld taxes surged 21.7%. The improved job market also lifted employment taxes (36% of total receipts) 6.3% y/y.
Corporate income taxes (10% of total receipts) surged 27.0% y/y during FY06's first nine monthsand estate & gift taxes rose 15.1% y/y.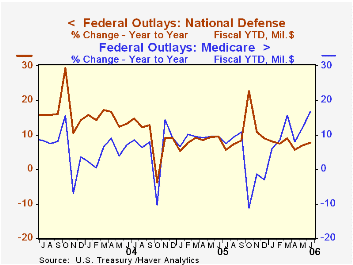
U.S. net outlays rose 8.8% FYTD versus '05. Defense spending (19% of total outlays) rose 7.8% during the first nine months of FY06 versus '05.Medicare spending (12% of total outlays) jumped 16.5% and spending on social security (21% of total outlays) remained strong at 5.8%. Spending on income security grew just 2.7%.
Social Security and Medicare : the impending fiscal challenge from the Federal Reserve Bank of Kansas City can be found here.
The Mid-Session Review of the U.S. Government Budget for FY 2007 is available here.
| US Government Finance | June | May | Y/Y | FY 2005 | FY 2004 | FY 2003 |
|---|---|---|---|---|---|---|
| Budget Balance | $20.5B | $-42.8B | $22.9B (6/05) | $-318.3B | $-412.7B | $-377.6B |
| Net Revenues | $264.4B | $192.7B | 12.6% | 14.5% | 5.5% | -3.8% |
| Net Outlays | $243.9B | $235.5B | 15.1% | 7.8% | 6.2% | 7.4% |
by Carol Stone July 13, 2006
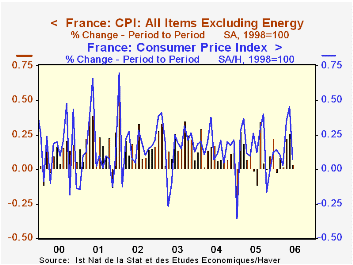
We continue to marvel at the low non-energy inflation rates in many countries. Today, June CPI was reported by two major countries, France and Germany, and the year-on-year pace excluding energy remains quite modest in both. For France, the monthly CPI was unchanged following a 0.3% increase in May. The 12-month rate is just 1.2%, about even with 2005's performance and only half of the increase in 2003. The overall index rose 0.1% in June and 1.9% year-on-year.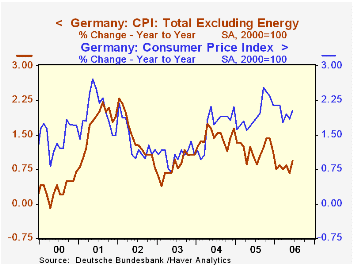
For Germany, the ex-energy monthly increase was 0.2%; this came after three consecutive increases of just 0.1% and the year-on-year rate is a mere 0.9%. This last has been less than 1.0% every month this year, with January and May as low as 0.7%. The total index rose 0.3% in June and stands 2.0% above June 2005.
In part, the modest CPI trends in both countries owe to restrained health care costs. These are much more administered sectors than in the US, of course, and except for periods of regulated changes, their price indexes tend not to move much. Communications costs continue to fall in both places as technology helps them decline in many countries. The culture and recreation sectors are also soft in France and Germany. In Germany, household goods and clothing remain weak, and in France they are running on a flat trend.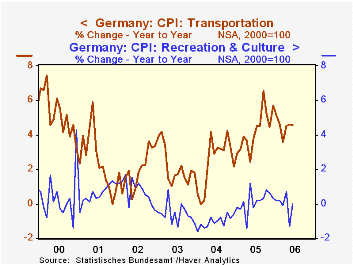
Sectors pushing upward on the price indexes include housing, transportation and travel. In each nation, the "housing" category, as in the US, includes fuel and electricity. So the pattern of relative inflation performance among various CPI components describes a situation that still confines the dramatic increases in energy to the sectors of each economy that are directly impacted: home heating, cooling, and lighting, driving and other transportation and other travel-related expenses. Another source of upward pressure in both France and Germany is food prices, but they are picking up from very slow rates; food inflation remains less than total inflation in both countries.
Haver maintains these price data in two different databases. Each country has a database, FRANCE and GERMANY, respectively, that contains data as published by local country sources. We also have "G10", a collection of data for a number of major countries (actually several more than 10). In that database, we make some calculations of our own on selected series. In the case of the CPI, we seasonally adjust more components than the statistical agencies of each country do. Another example is the calculation of GDP in US dollars, which is not usually published by the local country. So while there is generally more underlying detail in the country-sourced database, G10 contains some more analytical data that are useful for international comparisons and other purposes.
| % Changes, SA* | June 2006 | May 2006 | Apr 2006 | Year/Year | December/December|||
|---|---|---|---|---|---|---|---|
| 2005 | 2004 | 2003 | |||||
| France: Total CPI | 0.1 | 0.5 | 0.4 | 1.9 | 1.5 | 2.1 | 2.2 |
| ex Energy | 0.0 | 0.3 | 0.2 | 1.2 | 1.1 | 1.5 | 2.4 |
| Germany: Total CPI | 0.3 | 0.1 | 0.5 | 2.0 | 2.1 | 2.1 | 1.1 |
| ex Energy | 0.2 | 0.1 | 0.1 | 0.9 | 1.0 | 1.7 | 1.0 |
Tom Moeller
AuthorMore in Author Profile »Prior to joining Haver Analytics in 2000, Mr. Moeller worked as the Economist at Chancellor Capital Management from 1985 to 1999. There, he developed comprehensive economic forecasts and interpreted economic data for equity and fixed income portfolio managers. Also at Chancellor, Mr. Moeller worked as an equity analyst and was responsible for researching and rating companies in the economically sensitive automobile and housing industries for investment in Chancellor’s equity portfolio. Prior to joining Chancellor, Mr. Moeller was an Economist at Citibank from 1979 to 1984. He also analyzed pricing behavior in the metals industry for the Council on Wage and Price Stability in Washington, D.C. In 1999, Mr. Moeller received the award for most accurate forecast from the Forecasters' Club of New York. From 1990 to 1992 he was President of the New York Association for Business Economists. Mr. Moeller earned an M.B.A. in Finance from Fordham University, where he graduated in 1987. He holds a Bachelor of Arts in Economics from George Washington University.
More Economy in Brief
 Global| Feb 05 2026
Charts of the Week: Balanced Policy, Resilient Data and AI Narratives
by:Andrew Cates


