 Global| Jun 19 2003
Initial Jobless Insurance Claims Slipped
by:Tom Moeller
|in:Economy in Brief
Summary
Initial claims for unemployment insurance fell 3.0% last week to 421,000. The decline was from an upwardly revised level the prior week. Claims were slightly higher than Consensus expectations for 425,000. Weekly jobless claims are [...]

Initial claims for unemployment insurance fell 3.0% last week to 421,000. The decline was from an upwardly revised level the prior week. Claims were slightly higher than Consensus expectations for 425,000. Weekly jobless claims are down 8.3% from the peak in late April.
The latest figure is for the June survey period for nonfarm payrolls and it is down slightly from the May period.
The four-week moving average of initial claims fell slightly to 432,000 (+8.8% y/y).
During the last ten years there has been a 70% (inverse) correlation between the level of initial jobless insurance claims and the m/m change in nonfarm payrolls.
Continuing claims for unemployment insurance fell 1.6% w/w but the prior week's level was revised down slightly.
The insured rate of unemployment fell to 2.9% from 3.0%.
| Unemployment Insurance (000s) | 6/14/03 | 6/07/03 | Y/Y | 2002 | 2001 | 2000 |
|---|---|---|---|---|---|---|
| Initial Claims | 421.0 | 434.0 | 5.5% | 404.3 | 406.0 | 299.7 |
| Continuing Claims | -- | 3,721 | 0.8% | 3,575 | 3,022 | 2,114 |
by Tom Moeller June 19, 2002
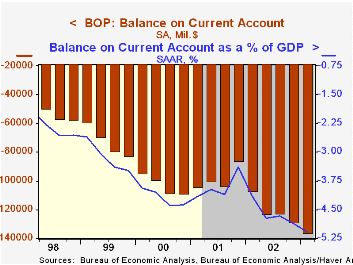
The US current account deficit deepened somewhat less than expected last quarter, but set a new record. The deficit in 2002 was revised shallower.
The deficit in goods trade deteriorated to $544.0B (AR) in 1Q03 versus a $482.9B deficit for all of last year and $427.2B in 2001. Exports of merchandise rose 1.4% following a 5.1% decline last year and a 6.9% drop in 2001. Goods imports rose 2.0% vs. a 1.6% rise last year.
The surplus on services fell to $57.7B (AR) last quarter but that was down from an upwardly revised surplus of $64.8B last year. The peak services surplus was $91.1B in 1997.
Analysis from the Federal Reserve Bank of Dallas titled "The Fruits of Free Trade" can be found here http://www.dallasfed.org/fed/annual/2002/ar02b.pdf
| US Int'l Balance of Payments | 1Q '03 | 4Q '02 | Y/Y | 2002 | 2001 | 2000 |
|---|---|---|---|---|---|---|
| Current Account Deficit | $136.1B | $128.6B | $106.7B | $480.9B | $393.7B | $411.5B |
| % of GDP | 5.1% | 4.9% | 4.1% | 4.6% | 3.9% | 4.2% |
| Goods/Services/Income Deficit | $119.0B | $113.2B | $90.8B | $422.0B | $347.1B | $355.8B |
| Exports | 0.3% | -0.9% | 5.0% | -4.3% | -9.3% | 12.8% |
| Imports | 1.6% | 0.4% | 11.1% | 1.2% | -7.9% | 18.2% |
| Unilateral Transfers Deficit | $17.1B | $15.4B | $15.9B | $58.9B | $46.6B | $55.7B |
by Tom Moeller June 19, 2003

The Conference Board reported that the Composite Index of Leading Economic Indicators rose 1.0% last month, much more than expected. Prior months' figures were unrevised.
Gains amongst the leaders' component series surged to 80%, the broadest breadth of one month gain since December 2001. The percentage of leading components rising over a six month period rose to 40%.
A higher money supply and higher consumer expectations had the largest positive influences on theMay leading index. Higher stock prices and lower claims for jobless insurance also made significant contributions. A narrower yield curve made a negative contribution.
The Leading index is based on eight previously reported economic data series and two that are estimated.
The coincident indicators rose slightly following two months unchanged.
The ratio of coincident-to-lagging indicators rose 0.2% to a new high. The ratio is an indicator of excess relative to actual economic performance.
Visit the Conference Board's site for coverage of leading indicator series from around the world.
| Business Cycle Indicators | May | April | Y/Y | 2002 | 2001 | 2000 |
|---|---|---|---|---|---|---|
| Leading | 1.0% | 0.1% | 0.2% | 2.1% | -0.9% | 1.0% |
| Coincident | 0.1% | 0.0% | 0.3% | -0.2% | -0.4% | 3.4% |
| Lagging | -0.1% | -0.4% | -2.0% | -4.4% | -1.3% | 2.8% |

Tom Moeller
AuthorMore in Author Profile »Prior to joining Haver Analytics in 2000, Mr. Moeller worked as the Economist at Chancellor Capital Management from 1985 to 1999. There, he developed comprehensive economic forecasts and interpreted economic data for equity and fixed income portfolio managers. Also at Chancellor, Mr. Moeller worked as an equity analyst and was responsible for researching and rating companies in the economically sensitive automobile and housing industries for investment in Chancellor’s equity portfolio. Prior to joining Chancellor, Mr. Moeller was an Economist at Citibank from 1979 to 1984. He also analyzed pricing behavior in the metals industry for the Council on Wage and Price Stability in Washington, D.C. In 1999, Mr. Moeller received the award for most accurate forecast from the Forecasters' Club of New York. From 1990 to 1992 he was President of the New York Association for Business Economists. Mr. Moeller earned an M.B.A. in Finance from Fordham University, where he graduated in 1987. He holds a Bachelor of Arts in Economics from George Washington University.
More Economy in Brief


