 Global| Oct 21 2004
Initial Jobless Insurance Claims Drop Suggests Labor Market Firmed
by:Tom Moeller
|in:Economy in Brief
Summary
Initial claims for unemployment insurance dropped 25,000 last week following a revised gain of 16,000 the week prior. The decline to 329,000 was to the lowest level in over a month and compared to the Consensus expectation for 345,000 [...]
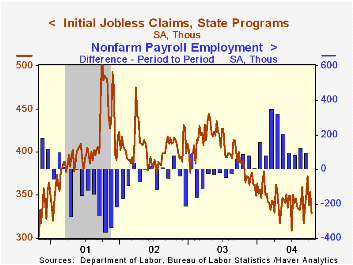
Initial claims for unemployment insurance dropped 25,000 last week following a revised gain of 16,000 the week prior. The decline to 329,000 was to the lowest level in over a month and compared to the Consensus expectation for 345,000 claims.
The latest figure is for the October survey period for nonfarm payrolls and initial claims fell 22,000 (6.3%) from the September period.
During the last ten years there has been a (negative) 73% correlation between the level of initial claims and the m/m change in payroll employment.
The 4-week moving average of initial claims fell to 348,250 (-11.1% y/y).
Ongoing claims for unemployment insurance fell 8,000 following a 51,000 decline the prior week that was revised from -11,000.
The insured rate of unemployment remained at 2.2% versus the downwardly revised level of the prior week.
"Why Do Americans Work So Much More Than Europeans?" by Nobel Prize winner Edward C. Prescott can be found here.
| Unemployment Insurance (000s) | 10/16/04 | 10/09/04 | Y/Y | 2003 | 2002 | 2001 |
|---|---|---|---|---|---|---|
| Initial Claims | 329 | 354 | -15.9% | 402 | 404 | 406 |
| Continuing Claims | -- | 2,798 | -19.7% | 3,531 | 3,570 | 3,018 |
by Tom Moeller October 21, 2004
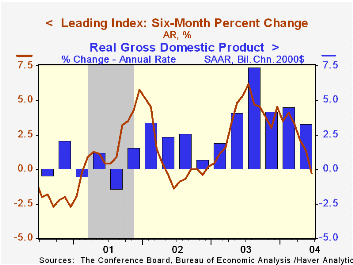
The 0.1% September decline in the Conference Board's Composite Index of Leading Economic Indicators was expected and the fourth consecutive monthly drop. August's 0.3% decline was unrevised.
Among the 10 components of the leading index 60% fell over a one month span with a narrower yield curve and quicker vendor deliveries providing the largest negative influences. Over a six month span 70% of the leaders fell.
The leading index is based on eight previously reported economic data series. Two series, orders for consumer goods and orders for capital goods, are estimated.
The coincident indicators rose 0.2% but the six-month growth rate slipped to 2.1% from its high of 3.3% early this year. During the last ten years there has been an 82% correlation between the six month growth in the coincident indicators and two quarter growth in real GDP.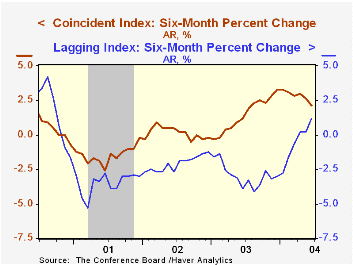
The lagging indicators were unchanged following a deepened 0.3% August drop. The ratio of the coincident to the lagging indicators, a measure of how the economy is performing relative to its excess, rose slightly but positive six month growth in the lagging index indicates that excesses may be building.
Visit the Conference Board's site for coverage of leading indicator series from around the world.
| Business Cycle Indicators | Sept | Aug | 6-Month Chg | 2003 | 2002 | 2001 |
|---|---|---|---|---|---|---|
| Leading | -0.1% | -0.3% | -0.3% | 1.3% | 2.2% | -0.8% |
| Coincident | 0.2% | 0.1% | 2.1% | 0.4% | -0.5% | -0.5% |
| Lagging | 0.0% | -0.3% | 1.2% | -2.2% | -2.8% | -1.4% |
by Tom Moeller October 21, 2004
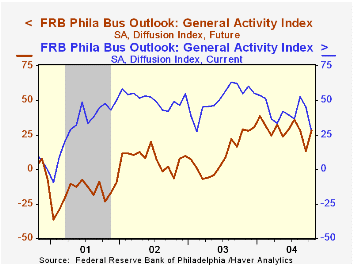
The Philadelphia Fed’s October index of general business conditions in the manufacturing sector rebounded more than expected to 28.5. The 15.1 point rise versus September exactly matched that month's drop. Consensus expectations had been for a lesser increase to 19.0.
During the last ten years there has been a 71% correlation between the level of the Philadelphia Fed Business Conditions Index and three month growth in factory sector industrial production. There has been a 53% correlation with q/q growth in real GDP.
Reversing the pattern of the prior month, virtually all of the sub indexes declined. The index for the number of employees fell to the lowest since June.
The business conditions index reflects a separate survey question, not the sub indexes.
The separate index of expected business conditions in six months dropped sharply for the second consecutive month.
The prices paid index rose to the second highest level since 1988. During the last ten years there has been a 75% correlation between the prices paid index and the three month growth in the PPI for intermediate goods. The correlation with the finished goods PPI has been 41% and with the CPI it's been 45%.
The Philadelphia Fed index is based on a survey of 250 regional manufacturing firms, but these firms sell nationally and internationally.
The latest Business Outlook survey from the Philadelphia Federal Reserve Bank can be found here.
| Philadelphia Fed Business Outlook | Oct | Sept | Oct '03 | 2003 | 2002 | 2001 |
|---|---|---|---|---|---|---|
| General Activity Index | 28.5 | 13.4 | 29.2 | 10.6 | 7.7 | -17.2 |
| Prices Paid Index | 57.1 | 56.4 | 23.5 | 16.7 | 12.2 | -0.9 |
by Tom Moeller October 21, 2004
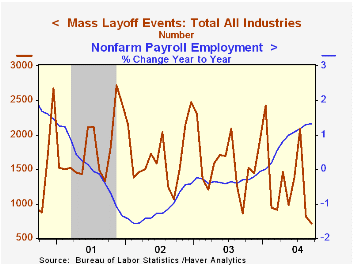
Mass layoffs in the US as reported to the Bureau of Labor Statistics fell another 12.5% following the 61.4% in August to the lowest level since August 1999.
These layoffs generated 68,972 (-16.5% y/y) initial claims for unemployment insurance.
Since the series inception in 1995 there has been a (negative) 45% correlation between the number of initial claims generated by mass layoffs and the one month change in non-farm payrolls.
The Mass Layoff Statistics (MLS) program collects reports on mass layoff actions that result in workers being separated from their jobs. Monthly mass layoff numbers are from establishments which have at least 50 initial claims for unemployment insurance (UI) filed against them during a 5-week period. Extended mass layoff numbers (issued quarterly) are from a subset of such establishments--where private sector non-farm employers indicate that 50 or more workers were separated from their jobs for at least 31 days.
| Mass Layoffs | Sept | Aug | Y/Y | 2003 | 2002 | 2001 |
|---|---|---|---|---|---|---|
| Number of Events: All Industries | 708 | 809 | -18.4% | 18,963 | 20,277 | 21,467 |
| Numbers of Persons Filing Initial Unemployment Insurance Claim: All Industries | 68,972 | 69,033 | -16.5% | 1,888,926 | 2,245,051 | 2,514,862 |

Tom Moeller
AuthorMore in Author Profile »Prior to joining Haver Analytics in 2000, Mr. Moeller worked as the Economist at Chancellor Capital Management from 1985 to 1999. There, he developed comprehensive economic forecasts and interpreted economic data for equity and fixed income portfolio managers. Also at Chancellor, Mr. Moeller worked as an equity analyst and was responsible for researching and rating companies in the economically sensitive automobile and housing industries for investment in Chancellor’s equity portfolio. Prior to joining Chancellor, Mr. Moeller was an Economist at Citibank from 1979 to 1984. He also analyzed pricing behavior in the metals industry for the Council on Wage and Price Stability in Washington, D.C. In 1999, Mr. Moeller received the award for most accurate forecast from the Forecasters' Club of New York. From 1990 to 1992 he was President of the New York Association for Business Economists. Mr. Moeller earned an M.B.A. in Finance from Fordham University, where he graduated in 1987. He holds a Bachelor of Arts in Economics from George Washington University.
More Economy in Brief


