 Global| Aug 03 2006
Initial Claims for Unemployment Insurance Rose
by:Tom Moeller
|in:Economy in Brief
Summary
Initial claims for unemployment insurance increased 14,000 to 315,000 last week following a revised 4,000 drop the prior week. Consensus expectations had been for 310,000 claims and during all of July claims averaged 314,000, up a bit [...]
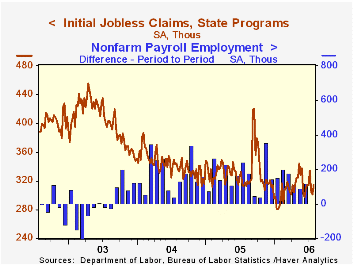
Initial claims for unemployment insurance increased 14,000 to 315,000 last week following a revised 4,000 drop the prior week. Consensus expectations had been for 310,000 claims and during all of July claims averaged 314,000, up a bit from 308,000 during June.
During the last ten years there has been a (negative) 78% correlation between the level of initial claims and the m/m change in nonfarm payroll employment.
The four-week moving average of initial claims rose to slightly 313,750 (-1.8% y/y).
Continuing claims for unemployment insurance rose 11,000 after a little revised 29,000 decline the prior week.
The insured rate of unemployment held steady at 1.9% where it has been since February.
Implementation of Optimal Monetary Policy from the Federal Reserve Bank of Richmond is available here.
| Unemployment Insurance (000s) | 07/29/06 | 07/22/06 | Y/Y | 2005 | 2004 | 2003 |
|---|---|---|---|---|---|---|
| Initial Claims | 315 | 301 | -0.9% | 332 | 343 | 403 |
| Continuing Claims | -- | 2,480 | -4.5% | 2,663 | 2,923 | 3,530 |
by Tom Moeller August 3, 2006
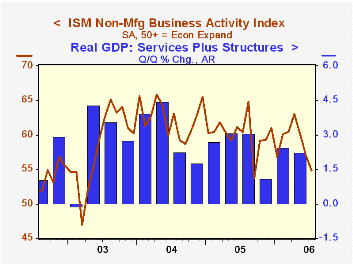
The Institute for Supply Management (ISM) reported that the July Business Activity Index for the non-manufacturing sector fell for the third straight month. The 2.2 point m/m decline to 54.8 exceeded Consensus expectations for a drop to 57.0 and left the index at its lowest level since September 2005.
Since the series' inception in 1997 there has been a 50% correlation between the level of the Business Activity Index and the q/q change in real GDP for services plus construction.
The new orders sub-index fell for the third consecutive month to the lowest level in three year. The employment index, however, recovered nearly half of a sharp six point decline in June. Since the series' inception in 1997 there has been a 60% correlation between the level of the ISM non-manufacturing employment index and the m/m change in payroll employment in the service producing plus the construction industries.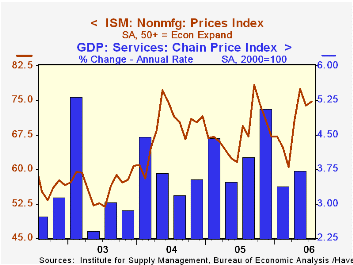
Pricing power also recovered a bit of its June decline and rose to 74.8, a level above the 2Q average. Since inception eight years ago, there has been a 70% correlation between the price index and the y/y change in the GDP services chain price index.
ISM surveys more than 370 purchasing managers in more than 62 industries including construction, law firms, hospitals, government and retailers. The non-manufacturing survey dates back to July 1997.Business Activity Index for the non-manufacturing sector reflects a question separate from the subgroups mentioned above. In contrast, the NAPM manufacturing sector composite index is a weighted average five components.
Instability in U.S. Inflation: 1967-2005 from the Federal Reserve Bank of Atlanta can be found here.
| ISM Nonmanufacturing Survey | July | June | July '05 | 2005 | 2004 | 2003 |
|---|---|---|---|---|---|---|
| Business Activity Index | 54.8 | 57.0 | 60.4 | 60.1 | 62.5 | 58.3 |
| Prices Index | 74.8 | 73.9 | 69.5 | 67.9 | 68.8 | 56.6 |
by Tom Moeller August 3, 2006
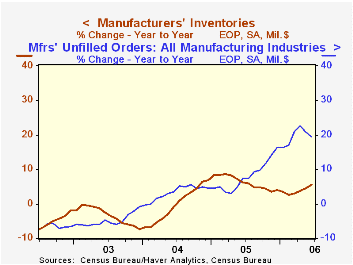
Factory inventories rose 0.8% during June for the fifth month of firm accumulation this year. Year to date inventories have risen at a 7.8% annual rate, nearly double the rate of accumulation during all of last year.
Primary metals inventories rose 0.8% (6.2% y/y) and have been rising at a 17.2% annual rate so far this year. Inventories of computers & electronic products rose 0.4% (8.4% y/y) and the year to date annual rate of accumulation has been 9.2%. Inventories of electrical equipment jumped 2.2% (9.3% y/y) but machinery inventories ticked up just 0.1% (5.7% y/y).
Total factory orders surged 1.2%. Durable goods orders jumped 2.9% that was little revised from the advance report of a 3.1% gain. Factory orders less transportation rose just 0.1% (7.8% y/y) due to a 0.7% drop in nondurables.
Factory shipments fell 0.3%. Less transportation shipments also fell 0.2% (8.0% y/y). Petroleum shipments fell 0.2% (+20.9% y/y) and factory shipments less transportation & petroleum slipped 0.2% (+6.7% y/y).
Unfilled orders increased another 1.6% but less the transportation sector altogether backlogs still rose a strong 1.4% (14.2% y/y).
| Factory Survey (NAICS) | June | May | Y/Y | 2005 | 2004 | 2003 |
|---|---|---|---|---|---|---|
| Inventories | 0.8% | 0.7% | 5.5% | 4.0% | 6.9% | -7.4% |
| New Orders | 1.2% | 1.0% | 6.0% | 8.5% | 7.5% | 0.9% |
| Shipments | -0.3% | 2.5% | 7.5% | 7.1% | 6.8% | 0.2% |
| Unfilled Orders | 1.6% | 0.7% | 19.3% | 16.3% | 4.5% | -1.0% |
by Carol Stone August 3, 2006
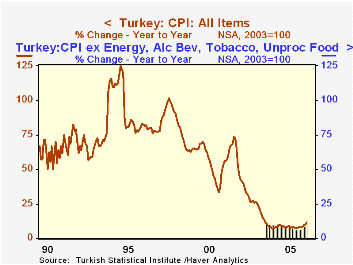
Inflation in Turkey has picked up a bit in recent months, but remains quite modest compared with Turkey's historical experience. The CPI in July was up 1.7% from June, seasonally adjusted (by Haver Analytics), and 11.7% from a year ago. June and May were both up about 10% from year-earlier levels. Our standard table shows only the last three years of data and for this period, these recent numbers would look a bit discouraging. Nonetheless, these are low. As recently as 2002, inflation ran just under 30% and from early 1994 to late 1998, the lowest 12-month reading was 75.7%, with numerous months above 100%.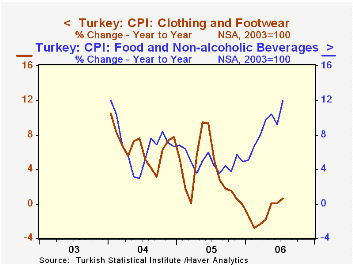
Since 2003, the Turkish Statistical Institute has published some detail data. As seen in the graph, food prices are one of the sources of the recent rise in inflation. Actually so are clothing prices, but at a much lower level: year-on-year changes were in fact negative in the first few months of 2006, but that index has stabilized and even risen slightly in May, June and July. Otherwise, we see that various measures of "core" inflation are not much affected by the exclusion of food, energy and administered prices.
Note that Turkey data offerings are contained in Haver's EMERGEMA database, which includes Middle Eastern and African countries.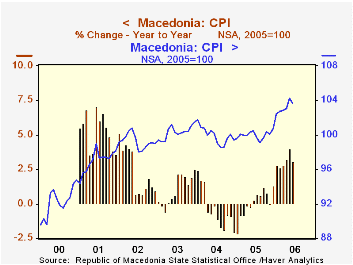
Haver is also accumulating a growing amount of data on other emerging markets. Late yesterday, the Statistical Office of Macedonia reported its consumer prices for June. These data are included in EMERGECW, along with other Central, Southern and Eastern European countries. Macedonia's total CPI began in 2000, with a standard breakdown starting in 2004. Over the time span available, inflation in that small nation (about the size of Vermont, according to the CIA's "World Factbook") has been quite modest. In June, the total index was 3.1% above June 2005, also a pickup the couple of years. In 2005 overall, the index rose just 1.3% and it fell in 2004 by 2.1%. Among components, food, energy and home furnishings all saw price weakness through part or all of 2005, but they have since firmed. However, their rates generally remain lower than elsewhere, with housing and utilities costs rising 1.3% in June and transportation 10.0%.
| CPI% Changes | July 2006 | June 2006 | May 2006 | December/December|||
|---|---|---|---|---|---|---|
| 2005 | 2004 | 2003 | ||||
| Turkey: SA, Mo/Mo | 1.7 | 1.2 | 2.1 | -- | -- | -- |
| NSA, Yr/Yr | 11.7 | 10.1 | 9.9 | 7.7 | 9.4 | 12.7 |
| Ex Energy | 11.2 | 9.6 | 9.9 | 7.8 | 8.7 | 12.2* |
| Ex Energy, Others** | 10.5 | 9.0 | 8.7 | 6.6 | 9.9 | 11.5* |
| Macedonia | -- | 3.1 | 4.0 | 1.3 | -2.1 | 2.5 |

Tom Moeller
AuthorMore in Author Profile »Prior to joining Haver Analytics in 2000, Mr. Moeller worked as the Economist at Chancellor Capital Management from 1985 to 1999. There, he developed comprehensive economic forecasts and interpreted economic data for equity and fixed income portfolio managers. Also at Chancellor, Mr. Moeller worked as an equity analyst and was responsible for researching and rating companies in the economically sensitive automobile and housing industries for investment in Chancellor’s equity portfolio. Prior to joining Chancellor, Mr. Moeller was an Economist at Citibank from 1979 to 1984. He also analyzed pricing behavior in the metals industry for the Council on Wage and Price Stability in Washington, D.C. In 1999, Mr. Moeller received the award for most accurate forecast from the Forecasters' Club of New York. From 1990 to 1992 he was President of the New York Association for Business Economists. Mr. Moeller earned an M.B.A. in Finance from Fordham University, where he graduated in 1987. He holds a Bachelor of Arts in Economics from George Washington University.
More Economy in Brief


