 Global| Aug 17 2006
Initial Claims for Unemployment Insurance Reverse Increase
by:Tom Moeller
|in:Economy in Brief
Summary
Initial claims for jobless insurance last week reversed all of the upwardly revised increase the prior period and fell 10,000 to 312,000. Consensus expectations had been for 317,000 claims. During July, claims averaged 314,000.A [...]
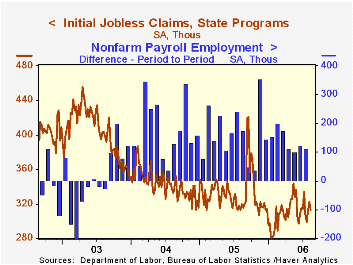
Initial claims for jobless insurance last week reversed all of the upwardly revised increase the prior period and fell 10,000 to 312,000. Consensus expectations had been for 317,000 claims.
During July, claims averaged 314,000.A portion of the decline from that level reflects a fall from levels that spiked higher during the automobile industry's annual summer shutdown.
The latest figure covers the survey period for August nonfarm payrolls and initial claims rose 7,000 (2.3%) from the July period.
During the last ten years there has been a (negative) 78% correlation between the level of initial claims and the m/m change in nonfarm payroll employment.
The less volatile four-week moving average of initial claims increased to 311,250 (-1.5% y/y).
Continuing claims for unemployment insurance rose 34,000 following a slightly revised 41,000 increase during the previous week.
The insured rate of unemployment remained unchanged at 1.9% where it has been since February.
An Update on the Status of the Economy and Its Implications for Monetary Policy is yesterday's speech by Dallas Federal Reserve Bank President Fisher and it is available here.
Labor Markets and the Macroeconomy: Conference Summary from the Federal Reserve Bank of San Francisco can be found here.
| Unemployment Insurance (000s) | 8/12/06 | 8/05/06 | Y/Y | 2005 | 2004 | 2003 |
|---|---|---|---|---|---|---|
| Initial Claims | 312 | 322 | -2.5% | 332 | 343 | 403 |
| Continuing Claims | -- | 2,507 | -3.5% | 2,662 | 2,924 | 3,532 |
by Tom Moeller August 17, 2006
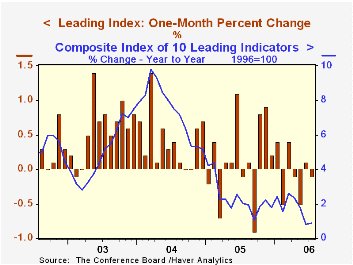
The composite index of leading economic indicators dipped 0.1% during July and reversed the June uptick. The figure reported by the Conference Board was the fourth m/m decline this year and compared to Consensus expectations for a 0.1% increase.
During the last ten years there has been a 59% correlation between the y/y change in the leading indicators and the lagged change in real GDP.
The breadth of one month gain amongst the 10 components of the leading index slipped to 55% from 60% in June.
The method of calculating the contribution to the leading index from the spread between 10 year Treasury securities and the Fed funds rate has been revised. A negative contribution will now occur only when the spread inverts rather than when declining as in the past. More details can be found here.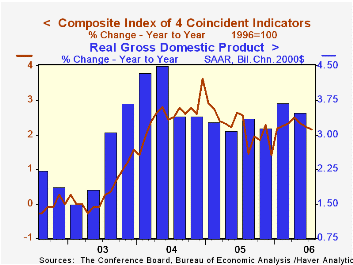
The leading index is based on eight previously reported economic data series. Two series, orders for consumer goods and orders for capital goods, are estimated.
The coincident indicators rose 0.2% for the sixth month this year. During the last one & six months all of the coincident series rose and over the last ten years there has been a 91% correlation between the y/y change in the coincident indicators and real GDP growth.
The lagging indicators reversed 0.1% of the prior month's revised 0.5% jump. The ratio of coincident to lagging indicators, a measure of actual economic performance versus excess, rose slightly for only the second month this year.
Visit the Conference Board's site for coverage of leading indicator series from around the world.
The Taylor Principle and Recent FOMC Policy from the Federal Reserve Bank of St. Louis can be found here.
| Business Cycle Indicators | July | June | Y/Y | 2005 | 2004 | 2003 |
|---|---|---|---|---|---|---|
| Leading | -0.1% | 0.1% | 0.9% | 2.3% | 7.4% | 5.0% |
| Coincident | 0.2% | 0.2% | 2.2% | 2.2% | 2.5% | 0.4% |
| Lagging | -0.1% | 0.5% | 2.6% | 3.5% | 0.0% | -0.0% |
by Carol Stone August 17, 2006
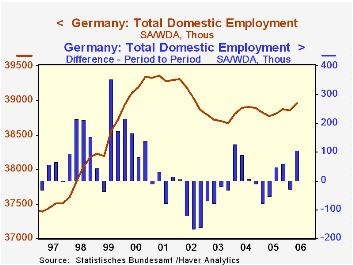
The German Federal Statistics Office today published the employment data that are inputs to the national accounts. So we can compare changes in GDP to changes in employment, yielding a rough measure of productivity in the German economy.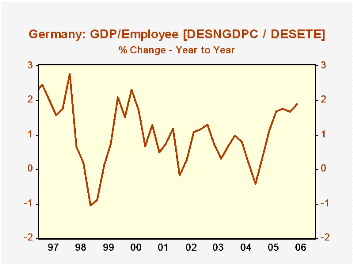
As reported Monday, GDP expanded 0.9% in Q2, an annual rate of 3.6%. Total domestic employment in Germany rose 1.1%, annualized, producing a gain in GDP/employee of 2.5%; this followed 3.0% in Q1. Thus, the first half-year saw this proxy for productivity increase at a 2.77% annual rate, which is the strongest two quarters since early 1998, eight years ago.
Employment is now also available by industry for Q2, and as seen in the table below, it continues to decline in the goods-producing sectors. This has been almost continuous since the combined data for East and West Germany begin in 1991. During that time, "industry" has declined from 30% of employment to right at 20% in Q1 and Q2 this year. To give this some context, in the US, the goods-producing sector (which also includes construction) has declined from 21% of nonfarm payrolls in early 1991 to 16.6% in the first half of 2006. 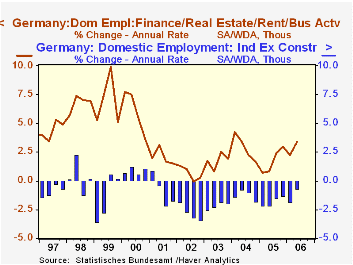
Among individual German industries, finance and other business services have shown the greatest growth, with Q2 up 2.7% from a year ago, while total employment gained just 0.5%. The second ranking growth has been in government, health and other community services, which are up 0.9% in Q2 over Q2 2005.
| Germany Millions, Seas Adj |
Q2 2006 | Q1 2006 | Q4 2005 | Year Ago | 2005 | 2004 | 2003 |
|---|---|---|---|---|---|---|---|
| Total Domestic Employment | 38.96 | 38.85 | 38.88 | 38.77 | 38.82 | 38.85 | 38.72 |
| Manufacturing | 7.42 | 7.43 | 7.46 | 7.52 | 7.51 | 7.63 | 7.75 |
| Construction | 2.12 | 2.13 | 2.15 | 2.17 | 2.16 | 2.25 | 2.32 |
| Trade, Hotels, Transportation, Etc. | 9.80 | 9.75 | 9.77 | 9.75 | 9.76 | 9.80 | 9.72 |
| Finance, Business Services | 6.55 | 6.49 | 6.46 | 6.37 | 6.40 | 6.30 | 6.13 |
| Gov't, Community Services | 11.85 | 11.83 | 11.81 | 11.74 | 11.76 | 11.63 | 11.54 |
| GDP Growth (%, SWDAAR) | 3.6 | 2.7 | 1.1 | 2.4 | 1.1 | 0.8 | -0.2 |
| Employment Growth (%, SWDAAR) | 1.1 | -0.3 | 0.6 | 0.5 | -0.1 | 0.4 | -0.9 |
| GDP/Employee (%, SWDAAR) | 2.5 | 3.0 | 0.5 | 1.9 | 1.2 | 0.4 | 0.8 |

Tom Moeller
AuthorMore in Author Profile »Prior to joining Haver Analytics in 2000, Mr. Moeller worked as the Economist at Chancellor Capital Management from 1985 to 1999. There, he developed comprehensive economic forecasts and interpreted economic data for equity and fixed income portfolio managers. Also at Chancellor, Mr. Moeller worked as an equity analyst and was responsible for researching and rating companies in the economically sensitive automobile and housing industries for investment in Chancellor’s equity portfolio. Prior to joining Chancellor, Mr. Moeller was an Economist at Citibank from 1979 to 1984. He also analyzed pricing behavior in the metals industry for the Council on Wage and Price Stability in Washington, D.C. In 1999, Mr. Moeller received the award for most accurate forecast from the Forecasters' Club of New York. From 1990 to 1992 he was President of the New York Association for Business Economists. Mr. Moeller earned an M.B.A. in Finance from Fordham University, where he graduated in 1987. He holds a Bachelor of Arts in Economics from George Washington University.
More Economy in Brief


