 Global| Jul 06 2006
Initial Claims for Unemployment Insurance Fell
by:Tom Moeller
|in:Economy in Brief
Summary
Initial unemployment insurance claims slipped 2,000 to 313,000 last week after a 6,000 rise the prior week that was upwardly revised, slightly. Consensus expectations had been for 315,000 claims. The four-week moving average of [...]
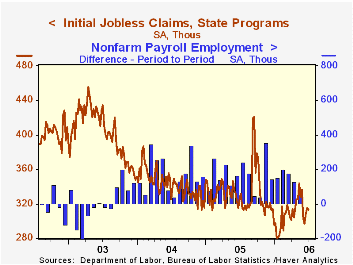
Initial unemployment insurance claims slipped 2,000 to 313,000 last week after a 6,000 rise the prior week that was upwardly revised, slightly. Consensus expectations had been for 315,000 claims.
The four-week moving average of initial claims rose to 308,500 (-4.8% y/y).
Continuing claims for unemployment insurance rose 52,000 following a 20,000 decline the previous week which was revised from a 54,000 increase reported initially.
The insured rate of unemployment was stable at 1.9% where it has been since February.
If You Lost Your Job from the Federal Reserve Bank of Minneapolis can be found here.
| Unemployment Insurance (000s) | 06/31/06 | 06/24/06 | Y/Y | 2005 | 2004 | 2003 |
|---|---|---|---|---|---|---|
| Initial Claims | 313 | 315 | -4.0% | 332 | 343 | 403 |
| Continuing Claims | -- | 2,455 | -5.6% | 2,663 | 2,923 | 3,530 |
by Tom Moeller July 6, 2006
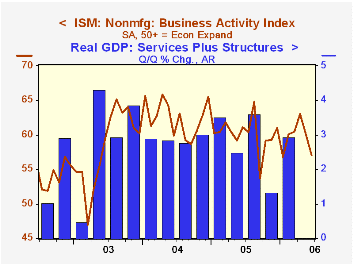
The June Business Activity Index for the non-manufacturing sector about matched the three point May decline and fell to 57.0, reported the Institute for Supply Management (ISM). Consensus expectations for a lesser decline to 59.0.
For 2Q the index average nevertheless rose modestly to 60.0 from 59.1 during 1Q. It was the highest quarterly average in a year. Since the series' inception in 1997 there has been a 50% correlation between the level of the Business Activity Index and the q/q change in real GDP for services plus construction.
The new orders index fell three points to 56.6, the lowest level since February and the employment index dropped a large six points to 52.0, its lowest since January. Since the series' inception in 1997 there has been a 60% correlation between the level of the ISM non-manufacturing employment index and the m/m change in payroll employment in the service producing plus the construction industries.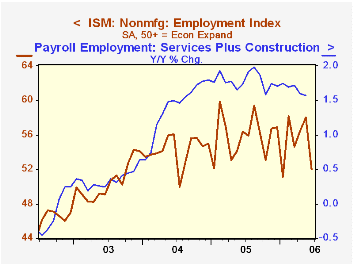
Pricing power eased modestly and gave up half of the prior month's sharp increase. Since inception eight years ago, there has been a 70% correlation between the price index and the y/y change in the GDP services chain price index.
ISM surveys more than 370 purchasing managers in more than 62 industries including construction, law firms, hospitals, government and retailers. The non-manufacturing survey dates back to July 1997.Business Activity Index for the non-manufacturing sector reflects a question separate from the subgroups mentioned above. In contrast, the NAPM manufacturing sector composite index is a weighted average five components.
| ISM Nonmanufacturing Survey | June | May | June '05 | 2005 | 2004 | 2003 |
|---|---|---|---|---|---|---|
| Business Activity Index | 57.0 | 60.1 | 61.1 | 60.1 | 62.5 | 58.3 |
| Prices Index | 73.9 | 77.5 | 61.6 | 67.9 | 68.8 | 56.6 |
by Tom Moeller July 6, 2006
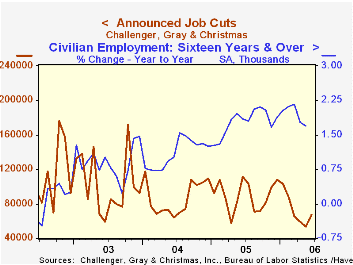
Challenger, Grey & Christmas indicated that announced job cuts rose 25.1% last month (67,176) to the highest level since February.
During the last ten years there has been an 83% (inverse) correlation between the three month moving average level of announced job cuts and the three month change payroll employment.
Increases m/m were pronounced in the automotive (-73.2% y/y), health care (+23.2% y/y), retail (-80.8% y/y), pharmaceutical (-27.5% y/y) and industrial goods (+45.9% y/y) industries.
Job cut announcements differ from layoffs. Many are achieved through attrition, early retirement or just never occur.
Challenger also reported a moderate m/m increase in announced hiring plans (-34.6% y/y).
| Challenger, Gray & Christmas | June | May | Y/Y | 2005 | 2004 | 2003 |
|---|---|---|---|---|---|---|
| Announced Job Cuts | 67,176 | 53,716 | -39.5% | 1,072,054 | 1,039,935 | 1,236,426 |
by Tom Moeller July 6, 2006
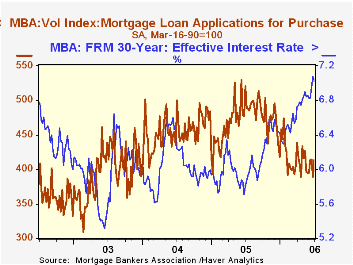
The total number of mortgage applications rose 5.9% last week and recovered about all of the prior week's sharp decline. For the month of June, the average number of applications fell 1.5% from May.
A 6.5% increase in purchase applications recovered all of the prior week's decline but nevertheless left the June average 0.8% below May which fell 0.8% from April.
During the last ten years there has been a 58% correlation between the y/y change in purchase applications and the change in new plus existing single family home sales.
Applications to refinance rose 5.0% after a 7.5% drop the prior week. Refis during all of June were 3.1% below the May average.
The effective interest rate on a conventional 30-year mortgage reversed half of the prior week's rise with a six basis point decline to 7.02%. The rate on 15-year financing reversed most of the prior week's gain with a seven basis point decline to 6.68%. Interest rates on 15 and 30 year mortgages are closely correlated (>90%) with the rate on 10 year Treasury securities.
During the last ten years there has been a (negative) 79% correlation between the level of applications for purchase and the effective interest rate on a 30-year mortgage.
The Mortgage Bankers Association surveys between 20 to 35 of the top lenders in the U.S. housing industry to derive its refinance, purchase and market indexes. The weekly survey accounts for more than 40% of all applications processed each week by mortgage lenders. Visit the Mortgage Bankers Association site here.
| MBA Mortgage Applications (3/16/90=100) | 06/30/06 | 06/23/06 | Y/Y | 2005 | 2004 | 2003 |
|---|---|---|---|---|---|---|
| Total Market Index | 561.0 | 529.6 | -34.3% | 708.6 | 735.1 | 1,067.9 |
| Purchase | 414.2 | 389.0 | -20.5% | 470.9 | 454.5 | 395.1 |
| Refinancing | 1,423.9 | 1,356.0 | -48.9% | 2,092.3 | 2,366.8 | 4,981.8 |
by Tom Moeller July 6, 2006
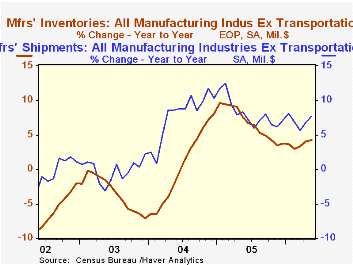
Factory inventory accumulation stalled during May but that followed an upwardly revised 1.0% April increase. Despite the latest stall, the running rate of inventory accumulation this year matches the gains in 2005.
Inventories of computers & electronic products fell 0.5% (+6.1% y/y) while inventories of electrical equipment dropped 0.3% (+6.5% y/y). Inventories of furniture & related products fell 0.3% (+4.6% y/y), the second down month, and primary metals inventories jumped 2.3% (4.0% y/y).
Total factory orders rose 0.7%, a gain led by a 1.6% jump in nondurables which reflected a 2.3% rise petroleum & coal. Less petroleum, nondurable goods orders (which equal shipments) rose 1.4% (3.1% y/y). Durable goods orders fell 0.2%, little revised from the advance report of a 0.3% slip.
Factory shipments surged 2.2% led higher by a 5.1% jump in transportation. Civilian aircraft shipments rose 19.8% (33.0% y/y). Less transportation shipments also were strong and rose 1.7% (7.7% y/y).
Unfilled orders rose another 0.6% led by a 1.5% (59.4% y/y) jump in civilian aircraft. Less the transportation sector altogether backlogs rose 0.9% (14.3% y/y).
| Factory Survey (NAICS) | May | April | Y/Y | 2005 | 2004 | 2003 |
|---|---|---|---|---|---|---|
| Inventories | -0.0% | 1.0% | 3.9% | 4.0% | 6.9% | -7.4% |
| New Orders | 0.7% | -2.0% | 4.9% | 8.5% | 7.5% | 0.9% |
| Shipments | 2.2% | -0.1% | 7.2% | 7.1% | 6.8% | 0.2% |
| Unfilled Orders | 0.6% | 1.5% | 20.7% | 16.3% | 4.5% | -1.0% |
by Carol Stone July 6, 2006

Mortgage equity withdrawal in the UK picked up in Q1, according to data reported today by the Bank of England. It came to £12,509 million, up from £12,121 million in Q4 and £6,478 million in the year-ago period. The Bank of England originated this concept about five years ago and gave it the name "mortgage equity withdrawal". It represents the borrowing by consumers on their homes which exceeds the amount necessary to finance the investment in the house itself. Because of recent strength in home prices over construction values, homeowners have considerable equity, and they have been leveraging that toward any number of unrelated purchases. This borrowing in the UK was equivalent to 5.8% of consumers' post-tax income in Q1. In 2003 and 2004, house prices were stronger and mortgage equity withdrawal was greater; 2003 was the peak year, with a total of £57,233 million, a quarterly average of £14,308 million and 7.5% of consumer income. [The relationship of MEW to HBOS (Halifax) house prices, which were also reported today through June, can be seen in the first graph.]
As we have discussed here previously, the same phenomenon has been occurring in the US, and we are struck by -- indeed, amazed -- at the similarity in the trends of this practice in each country. The volume of what we prefer to call "home equity withdrawal" also increased in Q1, recovering to $664.3 billion after falling in Q4 2005 to $619.3 billion. The peak quarter was $712.0 billion in Q3 2005. The series we cite is calculated by Haver, based on the value of residential investment by households, including improvements. [The Fed calculates a series based on the value of home sales and does not cover funding of improvements.] The Haver data, our series MEW1, equaled 7.2% of disposable income in Q1, compared with 6.7% in Q4 and 7.9% in Q3. 2005 was the big year for home equity withdrawal in the US, as easily noted in the accompanying graphs.
Comparing the trends in the UK and the US, we see in the second graph, there is an extraordinary 87% correlation between equity withdrawal in the two countries. The period of softness in the mid-1990s, with modest equity buildup (that is, negative MEW), was repeated in both economies. But MEW grew rapidly in both places in the late 1990s. The patterns diverge a bit in 2003, but continue to tell essentially the same story of homeowners' significant borrowing on their homes to finance other activity. The final graph shows a 66% correlation in the ratios of this borrowing to disposable income in each country, augmenting income resources by some 6% in recent years. Now housing markets are moderating in both countries, with a flattening or notable slowing of price gains and some hesitancy in sales. So it remains to be seen how MEW will behave in both the UK and the US and what the implications of that will be for consumer spending.
| Q1 2006 | Q4 2005 | Q3 2005 | Year Ago | 2005 | 2004 | 2003 | |
|---|---|---|---|---|---|---|---|
| UK: Mortgage Equity Withdrawal(Bil. £) | £12.5 | £12.1 | £9.2 | £6.5 | £9.5 | £12.4 | £14.3 |
| % of Post-Tax Income | 5.8% | 5.7% | 4.4% | 3.2% | 4.6% | 6.3% | 7.5% |
| HBOS House Price (000s £) | June 2006 | May 2006 | Apr 2006 | £163.0 | £165.4 | £157.0 | £132.2 |
| £176.5 | £178.7 | £178.9 | |||||
| Yr/Yr % Change | 8.2% | 10.0% | 9.9% | -- | 5.3% | 18.8% | 19.0% |
| US: Home Equity Withdrawal(Bil. $) | Q1 2006 | Q4 2005 | Q3 2005 | $429.1 | $591.3 | $475.2 | $451.8 |
| $664.3 | $619.3 | $712.0 | |||||
| % of Disp. Income | 7.2% | 6.7% | 7.9% | 4.8% | 6.5% | 5.5% | 5.5% |
Tom Moeller
AuthorMore in Author Profile »Prior to joining Haver Analytics in 2000, Mr. Moeller worked as the Economist at Chancellor Capital Management from 1985 to 1999. There, he developed comprehensive economic forecasts and interpreted economic data for equity and fixed income portfolio managers. Also at Chancellor, Mr. Moeller worked as an equity analyst and was responsible for researching and rating companies in the economically sensitive automobile and housing industries for investment in Chancellor’s equity portfolio. Prior to joining Chancellor, Mr. Moeller was an Economist at Citibank from 1979 to 1984. He also analyzed pricing behavior in the metals industry for the Council on Wage and Price Stability in Washington, D.C. In 1999, Mr. Moeller received the award for most accurate forecast from the Forecasters' Club of New York. From 1990 to 1992 he was President of the New York Association for Business Economists. Mr. Moeller earned an M.B.A. in Finance from Fordham University, where he graduated in 1987. He holds a Bachelor of Arts in Economics from George Washington University.


