 Global| Apr 20 2006
Initial Claims for Unemployment Insurance Drop
by:Tom Moeller
|in:Economy in Brief
Summary
Initial claims for jobless insurance reversed about all of the prior week's rise with a 10,000 worker decline to 303,000. Consensus expectations had been for an unchanged reading at 313,000 claims versus the prior week's unrevised [...]
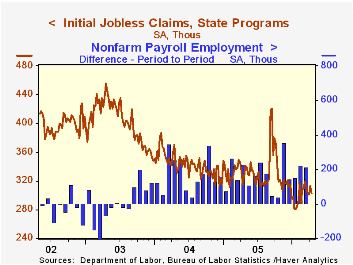
Initial claims for jobless insurance reversed about all of the prior week's rise with a 10,000 worker decline to 303,000. Consensus expectations had been for an unchanged reading at 313,000 claims versus the prior week's unrevised figure.
The latest figure covers the survey period for April nonfarm payrolls and claims fell 9,000 (-2.9%) from the March period.
During the last ten years there has been a (negative) 75% correlation between the level of initial jobless insurance claims and the m/m change in payroll employment.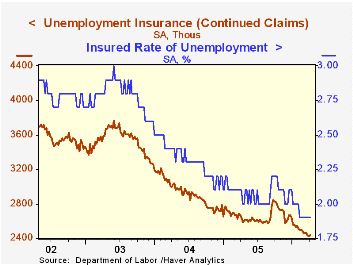
The four-week moving average of initial claims slipped to 305,250 (-9.2% y/y).
Continuing claims for unemployment insurance rose 18,000 during the latest week following a revised 11,000 decline the prior week.
The insured rate of unemployment was stable at 1.9% where it's been for almost two months.
Are We Working Too Hard of Should We Be Working Harder? A Sample Model of Career Concerns from the Federal Reserve Bank of Richmond is available here.
| Unemployment Insurance (000s) | 04/15/06 | 04/08/06 | Y/Y | 2005 | 2004 | 2003 |
|---|---|---|---|---|---|---|
| Initial Claims | 303 | 313 | -3.8% | 332 | 343 | 402 |
| Continuing Claims | -- | 2,439 | -7.6% | 2,662 | 2,924 | 3,532 |
by Tom Moeller April 20, 2006
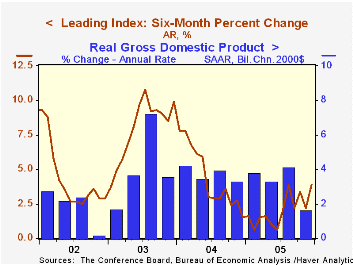
The Conference Board reported that during March, the Composite Index of Leading Economic Indicators fell 0.1% following a 0.5% February decline that was deeper than initially reported. The decline compared to Consensus expectations for no change.
Six month growth in the leaders slipped to 2.9%, about the middle of the range during the last several months. During the last ten years there has been a 43% correlation between the six-month change in the leading indicators and quarterly growth in real GDP.
The breadth of one month gain amongst the 10 components of the leading index improved to 60% in March from a downwardly revised 40% during February.
Lower building permits and higher initial claims for unemployment insurance made the largest negative contributions to last month's decline in the leaders last month.
For the third consecutive month, the spread between yields on the 10 year Treasury Note and Fed funds made a minimal 0.01 percentage point positive contribution to the leaders. The method of calculating the contribution to the index from the interest rate yield spread has been revised. A negative contribution will now occur only when the spread inverts rather than when declining as in the past. More details can be found here. 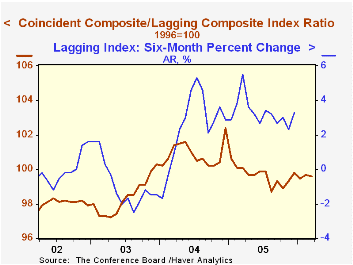
The leading index is based on eight previously reported economic data series. Two series, orders for consumer goods and orders for capital goods, are estimated.
The coincident indicators rose 0.2% following a like gain in February that was downwardly revised. All of the four component series rose last month and during the last six months. During the last ten years there has been a 64% correlation between the change in the coincident indicators and real GDP growth.
The lagging indicators increased 0.3% following an unrevised 0.1% February up tick. Last month, two thirds of the series' components rose while the ratio of coincident to lagging indicators, a measure of actual economic performance versus excess, slipped in March.
Visit the Conference Board's site for coverage of leading indicator series from around the world.
The latest World Economic Outlook from the International Monetary Fund can be found here.
| Business Cycle Indicators | Feb | Jan | 6 Month Chg., AR | 2005 | 2004 | 2003 |
|---|---|---|---|---|---|---|
| Leading | -0.1% | -0.5% | 2.9% | 2.3% | 7.4% | 5.0% |
| Coincident | 0.2% | 0.2% | 4.4% | 2.2% | 2.5% | 0.4% |
| Lagging | 0.3% | 0.1% | 2.5% | 3.5% | 0.0% | -0.0% |
by Carol Stone April 20, 2006
In March, consumer price inflation in Europe and North America eased or remained steady. Core inflation is also quiescent.
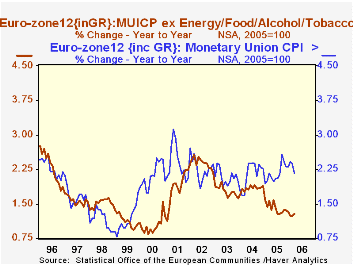
For the Euro-Zone12, the total CPI was up just 2.2% from a year ago, less than in 2005 and 2004. The core rate, which excludes food, energy, alcohol and tobacco, was a mere 1.3%; this is up very slightly from February and January, but equal to or lower than the last few years.
UK inflation is holding below 2.0% as March's figure eased 0.2% from February to 1.8%. Its core rate was also 0.2% lower, at 1.2% from 1.4% and for all of last year, 1.3%.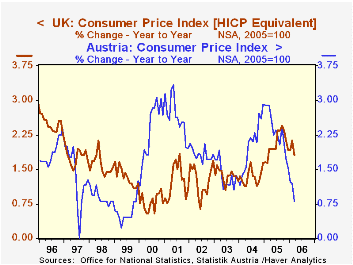
Incredibly, Austria's CPI has risen only 0.8% over the past year. In that country, health costs, transportation and communications, and education and recreation costs are all running slower; this is a fairly diverse group, indicating that no single factor is responsible for the slow pace.
Canada's CPI has been running just above a 2% trend for about three years. Its core, defined to exclude just food and energy, is edging a bit higher, but at 1.5% in March, is still quite temperate.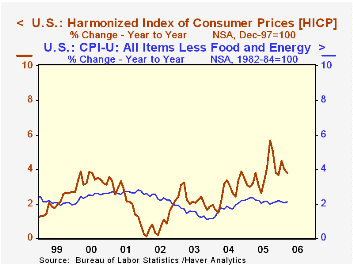
Finally, it is interesting to note that the high-inflation nation here is the US, with a year-on-year rate of 3.4% and the core at 2.1%. Yesterday, Tom Moeller described the month-to-month changes, which showed gains in a couple of categories coming off declines in February. Even so, the 12-month rate actually eased, similar to other countries, and the core rate was steady at 2.1% for a third straight month. Notably, the BLS has started to compile US CPI using the same structure as the Europeans, the so-called "harmonized index of consumer prices" or "HICP". On this basis, US inflation is higher still, at 3.7% in March, but it is no worse than 2005's similar number or 2004's 3.5%.
We continue to monitor these CPIs around the world for evidence that energy costs are pushing up other non-energy prices. So far, while it may "feel" to some of us, as consumers, that "things" are getting more expensive, the data everywhere show remarkable moderation in pricing of non-energy goods and services.
| NSA, Yr/Yr % Changes | Mar 2006 | Feb 2006 | Jan 2006 | December/December||||
|---|---|---|---|---|---|---|---|
| 2005 | 2004 | 2003 | 2002 | ||||
| Euro-Zone12 | 2.2 | 2.4 | 2.4 | 2.3 | 2.3 | 2.0 | 2.4 |
| Core* | 1.3 | 1.2 | 1.2 | 1.3 | 1.9 | 1.6 | 2.2 |
| UK | 1.8 | 2.0 | 1.9 | 1.9 | 1.7 | 1.3 | 1.7 |
| Core* | 1.2 | 1.4 | 1.2 | 1.3 | 1.3 | 0.9 | 1.8 |
| Austria | 0.8 | 1.2 | 1.2 | 1.5 | 2.9 | 1.3 | 1.8 |
| Canada | 2.2 | 2.2 | 2.8 | 2.2 | 2.1 | 2.0 | 3.9 |
| Core** | 1.5 | 1.4 | 1.4 | 1.3 | 1.4 | 1.0 | 3.9 |
| US | 3.4 | 3.6 | 4.0 | 3.4 | 3.3 | 1.9 | 2.4 |
| Core** | 2.1 | 2.1 | 2.1 | 2.2 | 2.2 | 1.1 | 1.9 |
| HICP | 3.7 | 4.0 | 4.5 | 3.7 | 3.5 | 1.8 | 2.2 |

Tom Moeller
AuthorMore in Author Profile »Prior to joining Haver Analytics in 2000, Mr. Moeller worked as the Economist at Chancellor Capital Management from 1985 to 1999. There, he developed comprehensive economic forecasts and interpreted economic data for equity and fixed income portfolio managers. Also at Chancellor, Mr. Moeller worked as an equity analyst and was responsible for researching and rating companies in the economically sensitive automobile and housing industries for investment in Chancellor’s equity portfolio. Prior to joining Chancellor, Mr. Moeller was an Economist at Citibank from 1979 to 1984. He also analyzed pricing behavior in the metals industry for the Council on Wage and Price Stability in Washington, D.C. In 1999, Mr. Moeller received the award for most accurate forecast from the Forecasters' Club of New York. From 1990 to 1992 he was President of the New York Association for Business Economists. Mr. Moeller earned an M.B.A. in Finance from Fordham University, where he graduated in 1987. He holds a Bachelor of Arts in Economics from George Washington University.


