 Global| Sep 25 2003
Initial Claims for Jobless Insurance Fell
by:Tom Moeller
|in:Economy in Brief
Summary
Initial claims for jobless insurance fell unexpectedly last week. The decline to 381,000 was from a level the prior week revised up 1,000 to 400,000. Expectations had been for claims of 400,000. Claims the prior week were for the [...]

Initial claims for jobless insurance fell unexpectedly last week. The decline to 381,000 was from a level the prior week revised up 1,000 to 400,000. Expectations had been for claims of 400,000.
Claims the prior week were for the September survey period for nonfarm payrolls and they were up slightly from the August survey week.
During the last ten years there has been a 80% correlation (inverse) between the level of initial claims and the y/y change in payroll employment.
The four-week moving average of initial claims fell to 407,000 (-1.3% y/y).
Continuing claims for unemployment insurance fell 28,000 to 3,631,000. The prior week's level was revised down.
The insured rate of unemployment held steady at 2.9%. The rate has averaged 2.9% since April.
| Unemployment Insurance (000s) | 9/20/03 | 9/13/03 | Y/Y | 2002 | 2001 | 2000 |
|---|---|---|---|---|---|---|
| Initial Claims | 381.0 | 400.0 | -6.6% | 404.3 | 406.0 | 299.7 |
| Continuing Claims | -- | 3,631 | 1.0% | 3,575 | 3,022 | 2,114 |
by Tom Moeller September 25, 2003

Durable goods orders fell 0.9% in August but the previously reported 1.0% rise in July was revised to 1.5%. Consensus expectations had been for a 1.0% rise.
Excluding the volatile transportation sector, durable orders fell 0.3% (3.3% y/y) following sizable gains in five of the prior seven months.
Orders for the transportation sector as a whole dropped 2.2% as orders for both motor vehicles and aircraft fell.
Excluding aircraft and parts, nondefense capital goods orders fell 0.8% (3.7% y/y).
Orders for computers & electronic products eased a slight 0.1% (12.1% y/y) following strong gains for much of this year. Orders for computers & related products fell 2.3% (18.2% y/y). Machinery orders fell a slight 0.7% (2.4% y/y) following two months of strong gain.
Shipments of durable goods gave back all of the prior month's gain and fell 2.9% (-1.4% y/y). Year-to-date shipments of durable goods were up 2.0%.
Durable inventories fell 0.4% last month (-3.1% y/y). Inventory decumulation continued across industries.
| NAICS Classification | Aug | July | Y/Y | 2002 | 2001 | 2000 |
|---|---|---|---|---|---|---|
| Durable Goods Orders | -0.9% | 1.5% | -1.9% | -1.7% | -10.5% | 3.2% |
| Nondefense Capital Goods | -2.0% | 1.4% | -3.4% | -7.2% | -15.5% | 7.4% |
by Tom Moeller September 25, 2003
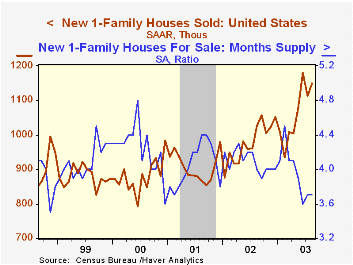
Sales of new single family homes slightly beat Consensus expectations for a 1.115M sales rate and rose to 1.15M. Sales in July were revised slightly.
Sales of new homes last month were the second highest on record.
Sales were strong and rose throughout the country, but in the South sales dipped 1.1% (10.2% y/y) for the second monthly decline.
The median price of a new home fell 4.2% to $184,500 (3.1% y/y). The prior month's figure was revised up.
The new home sales data reflect current sales versus the existing home sale figures which reflect closings on past sales.
| Homes Sales (000s, AR) | Aug | July | Y/Y | 2002 | 2001 | 2000 |
|---|---|---|---|---|---|---|
| New Single-Family | 1,150 | 1,112 | 12.2% | 977 | 907 | 880 |
by Tom Moeller September 25, 2003

Sales of existing single family homes handily beat Consensus expectations for a decline to 6.00M. The 5.5% gain in August to a record 6.470M added to a 5.1% rise the prior month which was revised up slightly.
The figures reflect closings of past home sales.
Sales rose in each of the country's regions. Huge gains were logged in the West, up 8.0% (24.8% y/y), and in the South where sales rose 6.5% (22.4% y/y). In the Northeast sales rose 1.4% m/m (12.7% y/y) and in the Midwest sales rose 3.0% (22.1% y/y).
The median price of an existing home fell m/m to $177,500 (+9.8% y/y).
The latest release from the National Association of Realtors is available here.
| Existing Home Sales (000, AR) | Aug | July | Y/Y | 2002 | 2001 | 2000 |
|---|---|---|---|---|---|---|
| Existing Single-Family | 6,470 | 6,130 | 21.8% | 5,595 | 5,292 | 5,158 |
by Tom Moeller September 25, 2003
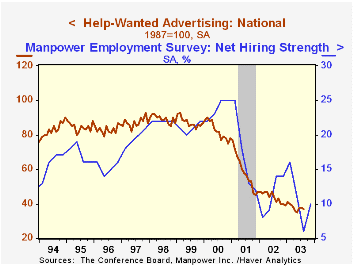
The Conference Board’s National Index of Help-Wanted Advertising fell slightly last month to 37, the midpoint of a depressed range of readings in place since March.
During the last ten years there has been a 93% correlation between the level of help-wanted advertising and the year-to-year change in nonfarm payrolls.
The proportion of labor markets with rising want-ad volume improved just slightly to 45% from a depressed July reading of 35%.
The Conference Board surveys help-wanted advertising volume in 51 major newspapers across the country every month.
| Conference Board | Aug | July | Aug '02 |
|---|---|---|---|
| National Help Wanted Index | 37 | 38 | 41 |
by Tom Moeller September 25, 2003

The Chicago Fed National Activity Index (CFNAI) fell in August to –0.28 versus 0.05 in July which was revised up slightly.
A zero value of the CFNAI indicates that the economy is expanding at its historical trend rate of growth of over 3%.
The three-month moving average of the CFNAI improved to –0.16 from -0.18 the prior period.
The CFNAI is a weighted average of 85 indicators of economic activity. The indicators reflect activity in the following categories: production and income, the labor market, personal consumption and housing, manufacturing and trade sales, and inventories & orders.
For a complete discussion of the latest Chicago Fed's National Activity Index click here.
| Chicago Fed | Aug | July | Aug '02 | 2002 | 2001 | 2000 |
|---|---|---|---|---|---|---|
| CFNAI | -0.28 | 0.05 | -0.62 | -0.34 | -1.19 | -0.12 |

Tom Moeller
AuthorMore in Author Profile »Prior to joining Haver Analytics in 2000, Mr. Moeller worked as the Economist at Chancellor Capital Management from 1985 to 1999. There, he developed comprehensive economic forecasts and interpreted economic data for equity and fixed income portfolio managers. Also at Chancellor, Mr. Moeller worked as an equity analyst and was responsible for researching and rating companies in the economically sensitive automobile and housing industries for investment in Chancellor’s equity portfolio. Prior to joining Chancellor, Mr. Moeller was an Economist at Citibank from 1979 to 1984. He also analyzed pricing behavior in the metals industry for the Council on Wage and Price Stability in Washington, D.C. In 1999, Mr. Moeller received the award for most accurate forecast from the Forecasters' Club of New York. From 1990 to 1992 he was President of the New York Association for Business Economists. Mr. Moeller earned an M.B.A. in Finance from Fordham University, where he graduated in 1987. He holds a Bachelor of Arts in Economics from George Washington University.
More Economy in Brief


