 Global| Feb 23 2006
Initial Claims for Jobless Insurance Back Down
by:Tom Moeller
|in:Economy in Brief
Summary
Initial unemployment insurance claims for dropped 20,000 to 278,000 last week. The decline reversed all of the prior week's increase which was slightly revised. Consensus expectations had been for 298,000 claims. The latest figure [...]
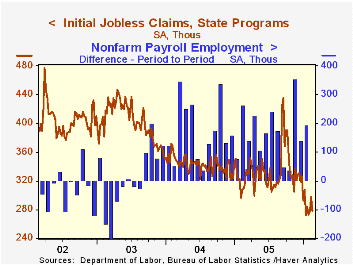
Initial unemployment insurance claims for dropped 20,000 to 278,000 last week. The decline reversed all of the prior week's increase which was slightly revised. Consensus expectations had been for 298,000 claims.
The latest figure covers the survey period for February nonfarm payrolls and claims were up 6,000 (2.2%) from the January period.
During the last ten years there has been a (negative) 75% correlation between the level of initial jobless insurance claims and the m/m change in payroll employment.
The four-week moving average of initial claims rose to 281,750 (-8.8% y/y).
Continuing unemployment insurance claims rose 41,000 and reversed nearly half of the prior week's revised 98,000 decline which was much deeper than initially estimated.
The insured rate of unemployment was stable at 1.9% for the third of the last four weeks.
A new study titled Globalization and Offshoring of Software by the Association for Computing Machinery can be found here.
| Unemployment Insurance (000s) | 02/18/06 | 02/11/06 | Y/Y | 2005 | 2004 | 2003 |
|---|---|---|---|---|---|---|
| Initial Claims | 278 | 298 | -10.0% | 332 | 343 | 402 |
| Continuing Claims | -- | 2,495 | -5.4% | 2,663 | 2,924 | 3,532 |
by Tom Moeller February 23, 2006
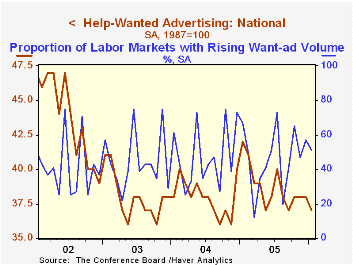
The Index of Help-Wanted Advertising from the Conference Board fell to 37 from a revised level of 38 in December. The decline was to the lower end of a range between 37 and 40 in place since the Spring of last year.
During the last ten years there has been a 62% correlation between the level of help-wanted advertising and the three month change in non-farm payrolls.
The proportion of labor markets with rising want-ad volume similarly fell back to 51 though that remained slightly improved versus last year's average.
The Conference Board surveys help-wanted advertising volume in 51 major newspapers across the country every month.
The latest help wanted report from the Conference Board is available here.
Turbulent Firms, Turbulent Wages? from the Federal Reserve Bank of New York can be found here.
| Conference Board | Jan | Dec | Jan '05 |
|---|---|---|---|
| National Help Wanted Index | 37 | 38 | 42 |
by Tom Moeller February 23, 2006
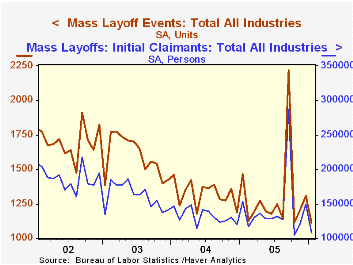
Mass layoffs in January reversed all of the prior month's revised increase and fell 27.5%. The decline in the number of mass layoff events was to the lowest level since October, 2000.
During the last ten years there has been a (negative) 87% correlation between the three month average level of layoff announcements and the y/y change in payroll employment.
The number of persons affected in December by mass layoffs also fell sharply. The 27.5% m/m decline similarly reversed all of December's gain as layoffs in the construction industry plummeted (-76.4% y/y) with record warm temperatures. The number of affected workers in the factory sector also fell sharply (-49.7% y/y) and industry declines were widespread.
The Mass Layoff Statistics (MLS) program collects reports on mass layoff actions that result in workers being separated from their jobs. Monthly mass layoff numbers are from establishments which have at least 50 initial claims for unemployment insurance (UI) filed against them during a 5-week period
| Mass Layoffs | Jan | Dec | Y/Y | 2005 | 2004 | 2003 |
|---|---|---|---|---|---|---|
| All US Industries (# Events, SA) | 1,113 | 1,308 | -24.0% | 15,670 | 15,877 | 19,155 |
| Total (# Persons, SA) | 108,378 | 149,565 | -29.5% | 1,717,119 | 1,589,446 | 1,936,463 |
by Carol Stone February 23, 2006
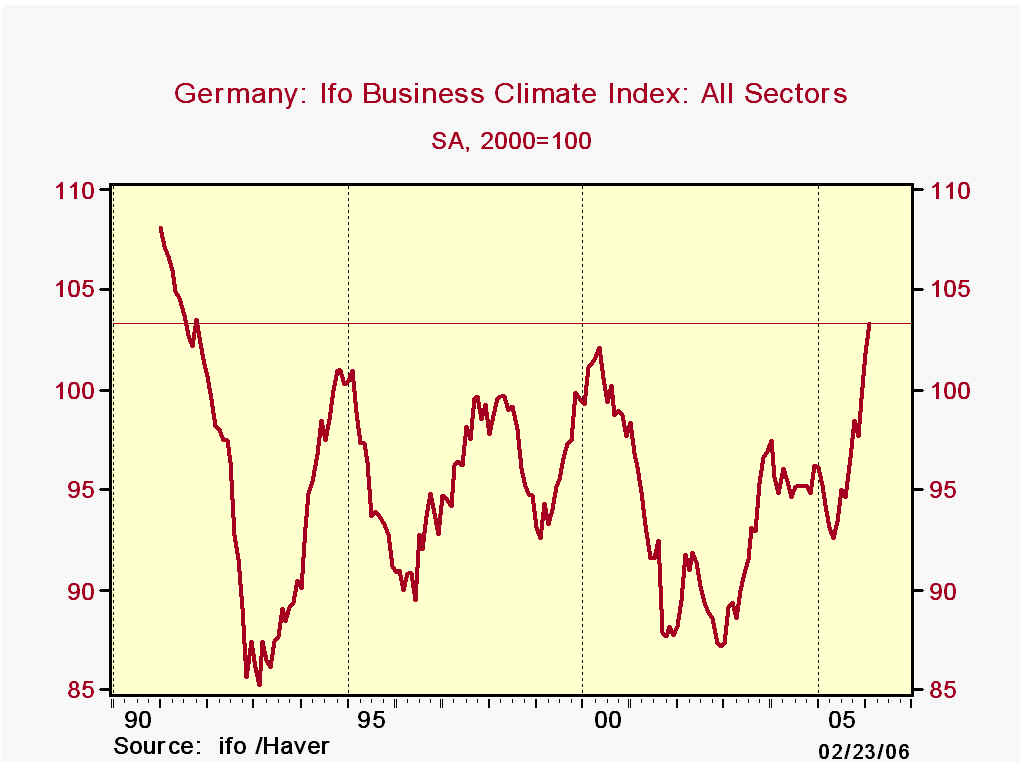
Germany's Ifo Business Climate survey continued and spread the better news about European industry which has been flowing out this week. After a surprisingly good result in January, forecasters expected that the February Ifo index would retreat a bit. But it added another 1.3 points to the 2000-based index, bringing the level to 103.3, the highest since July 1991. The accompanying diffusion measure rose to +5.8%, its best since October 1991.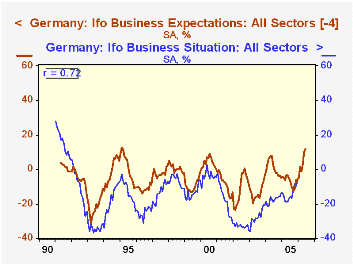
The improvement was visible in both current conditions and expectations. The "Business Situation" measure of current activity "rose" to -0.3% for February from -4.5% last month and -15.5% a year ago. Expectations, usually higher than current conditions (but not always) and tending to lead (by about 4 months, as seen in the graph) have been positive in four of the last five months and reached +12% in February, their strongest since late 1994. The leading tendency suggests that the improvement in the business climate should continue in coming months.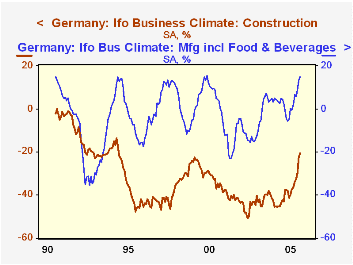
All major sectors participated in February's advance: manufacturing, already indicating a net expansion for many months, reached +14.9%, the best level in six years. Construction and retailing activity are still well in negative territory, but have improved dramatically, nonetheless: retailing stands at -7.0% compared with -28.7% a year ago and construction was "only" -20.5%, compared with -42.9% a year ago. This last, while the weakest sector overall, is perhaps most impressive. If prospects for construction activity are looking better, that likely reflects business leaders' belief that the progress in other sectors will justify at least some expansion and/or modernization of facilities. The better outlook in retailing also suggests that those business executives see relative improvements in consumer spending.
| Germany (SA) | Feb 2006 | Jan 2006 | Dec 2005 | Year Ago | 2005 | 2004 | 2003 |
|---|---|---|---|---|---|---|---|
| Ifo Business Climate Index, 2000 = 100 |
103.3 | 101.8 | 99.6 | 95.2 | 95.5 | 95.5 | 91.8 |
| Diffusion % | +5.8 | +2.6 | -1.7 | -10.3 | -9.8 | -10.0 | -17.2 |
| Manufacturing: Diffusion % | +14.9 | +13.6 | +8.9 | +2.5 | +1.1 | +4.4 | -7.9 |
| Construction: Diffusion % | -20.5 | -22.1 | -29.8 | -42.9 | -37.4 | -42.6 | -42.9 |
| Business Situation: Diffusion % | -0.3 | -4.5 | -6.3 | -15.5 | -14.2 | -17.4 | -27.2 |
| Business Expectations: Diffusion % | +12.0 | +10.8 | +3.0 | -5.0 | -5.2 | -2.2 | -6.7 |

Tom Moeller
AuthorMore in Author Profile »Prior to joining Haver Analytics in 2000, Mr. Moeller worked as the Economist at Chancellor Capital Management from 1985 to 1999. There, he developed comprehensive economic forecasts and interpreted economic data for equity and fixed income portfolio managers. Also at Chancellor, Mr. Moeller worked as an equity analyst and was responsible for researching and rating companies in the economically sensitive automobile and housing industries for investment in Chancellor’s equity portfolio. Prior to joining Chancellor, Mr. Moeller was an Economist at Citibank from 1979 to 1984. He also analyzed pricing behavior in the metals industry for the Council on Wage and Price Stability in Washington, D.C. In 1999, Mr. Moeller received the award for most accurate forecast from the Forecasters' Club of New York. From 1990 to 1992 he was President of the New York Association for Business Economists. Mr. Moeller earned an M.B.A. in Finance from Fordham University, where he graduated in 1987. He holds a Bachelor of Arts in Economics from George Washington University.
More Economy in Brief


