 Global| Mar 17 2006
Industrial Production Up As Expected
by:Tom Moeller
|in:Economy in Brief
Summary
Overall industrial output surged an expected 0.7% during February. The rise, however, was entirely due to a 7.9% rebound in utility output as winter temperatures returned to normal. Utility output had fallen 11.5% during the record [...]
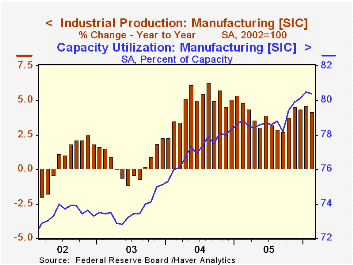
Overall industrial output surged an expected 0.7% during February. The rise, however, was entirely due to a 7.9% rebound in utility output as winter temperatures returned to normal. Utility output had fallen 11.5% during the record warm January.
Factory sector production was unchanged following the upwardly revised 0.8% January increase and m/m declines in output were widespread amongst industries.
Motor vehicles & parts fell 0.8% (-2.0% y/y) after a 2.4% spurt in January. Excluding motor vehicles, factory output inched up 0.1% (4.8% y/y). That increase very much reflected a 1.2% (19.0% y/y) jump in output of computer & electronic components. Excluding both autos and high tech, factory output was unchanged (+3.6% y/y) during February.
Output of primary metals slipped 0.1% (+4.2% y/y) last month and the 0.5% (+4.6% y/y) decline in machinery output was the second in a row. Electrical equipment & appliance output dropped 1.7% (+7.3% y/y) but furniture & related products output rose 1.3% (-1.6% y/y).
The 0.2% decline (+1.5% y/y) in nondurables output reflected a 0.5% (+2.4% y/y) fall in apparel output and a 1.8% (-4.2% y/y) drop in petroleum & coal production.
Total capacity utilization rose to 81.2% although factory sector utilization reversed a bit of the prior month's jump and fell to 80.4% versus an average 78.9% during 2005.
Greenspan's Unconventional View of the Long-Run Inflation/Output Trade-off from the Federal Reserve Bank of St. Louis is available here.
| Production & Capacity | Feb | Jan | Y/Y | 2005 | 2004 | 2003 |
|---|---|---|---|---|---|---|
| Total Industrial Production | 0.7% | -0.3% | 3.3% | 3.2% | 4.1% | 0.6% |
| Manufacturing | 0.0% | 0.8% | 4.1% | 3.9% | 4.8% | 0.5% |
| Consumer Goods | 0.8% | -0.8% | 1.8% | 2.1% | 2.1% | 1.0% |
| Business Equipment | 0.1% | 1.2% | 10.4% | 9.1% | 9.3% | 0.0% |
| Capacity Utilization | 81.2% | 80.8% | 80.0% (2/05) | 80.1% | 78.6% | 75.7% |
by Tom Moeller March 17, 2006
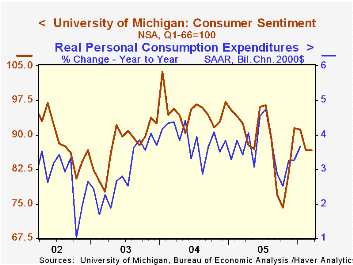
The index of consumer sentiment remained unchanged early this month versus February at 86.7, according to the University of Michigan. Consensus expectations for an increase to 88.0.
Sentiment figures are not seasonally adjusted and during the last ten years there has been a 76% correlation between the level of consumer sentiment and the y/y change in real consumer spending.
The current conditions index ticked up 0.6% m/m after a 4.3% decline during February. The index of personal finances rose just 0.9% (-3.4% y/y) after the 5.1% February collapse and the reading of buying conditions for large household goods remained unchanged (-0.6% y/y). Consumers' assessment of gov't economic policy fell to the lowest level this year. The index level of 80 (-14.0% y/y) compared to an average of 88 during 2005.
Consumer expectations slipped 0.4% from February, the third consecutive monthly decline. The economic outlook deteriorated sharply with the index of expected business conditions during the next twelve months off 5.2% (-12.5% y/y).
The mean expected inflation rate for the next twelve months rose m/m to 3.8%, still well below the 5.5% expected in October & September.
The University of Michigan survey is not seasonally adjusted.The mid-month survey is based on telephone interviews with 250 households nationwide on personal finances and business and buying conditions. The survey is expanded to a total of 500 interviews at month end.
Consumer Sentiment, the Economy, and the News Media from the Federal Reserve board can be found here.
| University of Michigan | March (p) | Feb | Y/Y | 2005 | 2004 | 2003 |
|---|---|---|---|---|---|---|
| Consumer Sentiment | 86.7 | 86.7 | -6.4% | 88.6 | 95.2 | 87.6 |
| Current Conditions | 106.2 | 105.6 | -1.7% | 105.9 | 105.6 | 97.2 |
| Expectations | 74.2 | 74.5 | -10.4% | 77.4 | 88.5 | 81.4 |
by Carol Stone March 17, 2006
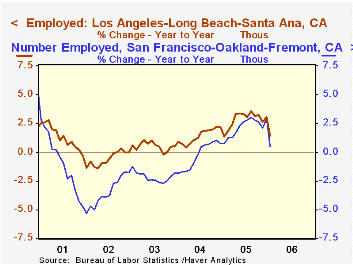
This morning, the Bureau of Labor Statistics published January employment and unemployment data for US metropolitan areas. These are contained in Haver's EMPLR database. The database includes labor force, employment, unemployment and unemployment rates for states, Census regions, metro areas and smaller municipalities. The data for states and some of the metro areas are available seasonally adjusted, but the data shown here for 8 selected large US metro areas are all not seasonally adjusted.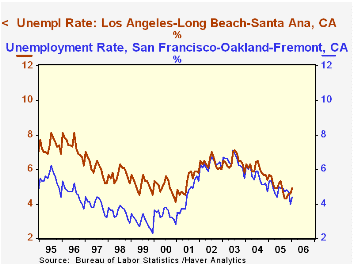
We spoke yesterday and the day before about labor market conditions in Europe and commented that such conditions can vary widely, even in neighboring regions there. The same is true here, as seen in the differences between Los Angeles and San Francisco. The economies of these two West Coast cities surely have differing characters, and this appears in the employment trends and the level of the unemployment rates. Employment growth in LA has generally been stronger, but the unemployment rate in San Francisco tends to be lower.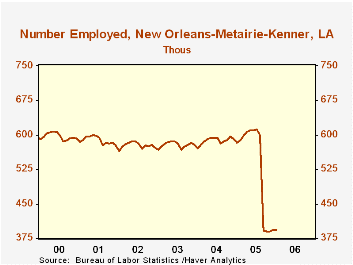
Denver, with a fairly consistent growth trend over the past several years nevertheless has an unemployment rate slightly higher than the national average, at least in the latest month. We are pleasantly surprised by the good growth in our own locale, New York City, over the past two years, a nice cyclical rebound after the 2001 recession and the developments associated with 9/11.
Such major non-economic events can have a pointed economic impact, of course. Hurricane Katrina was devastating to the economy of New Orleans, and these figures show how dramatic that has been. Employment in the New Orleans-Metairie-Kenner MSA is off by nearly 200,000 from a year ago. The unemployment rate there is more than 50% higher than for the nation as a whole. Notably, though, employment has edged upward in the last three months. The increase totals only 2,900, but it's certainly a step in the right direction for that city.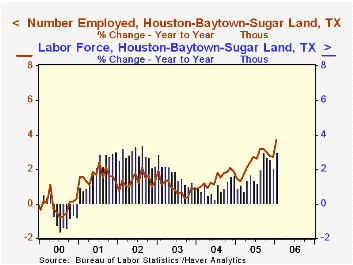
Finally, Houston may be a beneficiary of migration out of New Orleans. Even though the September "reference week" for labor market data was very soon after the storm, that month showed a marked and unusual increase in the Houston area labor force. Compared with the total drop in New Orleans, this 24,700 increase is just a fraction, but September has often been a month when the Houston labor force declines, implying that a special factor was in play. A boost to employment in Houston seems to have come just in January, when the normal post-Christmas drop in the number employed did not take place, but instead held just about steady with December. In the previous 16 years of data, the smallest decrease in January was 14,000.
It is often said that "all politics is local". The widely varying developments in labor markets reported this week in both entire adjoining countries and individual US cities suggest that much of economics must be local too.
| Jan 2006 | Mo/Mo % Chg | Jan 2005 | Yr/Yr % Chg | 2005 | 2004 | 2003 | ||
|---|---|---|---|---|---|---|---|---|
| Unemploy ment Rate | Number Employed | |||||||
| Total US | 5.1 | 141,481 | -1.0 | 138,682 | 2.0 | 1.8 | 1.1 | 0.9 |
| Los Angeles | 4.9 | 6,117 | -2.9 | 6,032 | 1.4 | 2.9 | 1.4 | 0.5 |
| San Francisco | 4.4 | 2,078 | -3.1 | 2,067 | 0.5 | 2.2 | -0.3 | -2.2 |
| Denver | 5.3 | 1,238 | -0.3 | 1,222 | 1.3 | 1.2 | 2.1 | 1.6 |
| Houston | 5.6 | 2,512 | -0.0 | 2,422 | 3.7 | 2.4 | 1.4 | 0.9 |
| New Orleans | 7.8 | 394 | 0.2 | 582 | -32.4 | -9.6 | 1.5 | 0.2 |
| Chicago | 5.6 | 4,466 | -0.2 | 4,440 | 0.6 | 0.8 | 1.2 | -0.0 |
| Boston | 4.7 | 2,317 | -1.4 | 2,311 | 0.2 | 0.1 | 0.0 | -1.3 |
| New York | 5.1 | 8,742 | -0.5 | 8,570 | 2.0 | 1.6 | 1.3 | -0.2 |

Tom Moeller
AuthorMore in Author Profile »Prior to joining Haver Analytics in 2000, Mr. Moeller worked as the Economist at Chancellor Capital Management from 1985 to 1999. There, he developed comprehensive economic forecasts and interpreted economic data for equity and fixed income portfolio managers. Also at Chancellor, Mr. Moeller worked as an equity analyst and was responsible for researching and rating companies in the economically sensitive automobile and housing industries for investment in Chancellor’s equity portfolio. Prior to joining Chancellor, Mr. Moeller was an Economist at Citibank from 1979 to 1984. He also analyzed pricing behavior in the metals industry for the Council on Wage and Price Stability in Washington, D.C. In 1999, Mr. Moeller received the award for most accurate forecast from the Forecasters' Club of New York. From 1990 to 1992 he was President of the New York Association for Business Economists. Mr. Moeller earned an M.B.A. in Finance from Fordham University, where he graduated in 1987. He holds a Bachelor of Arts in Economics from George Washington University.
More Economy in Brief


