 Global| Jan 30 2006
Industrial Production in Japan Rises for Fifth Successive Month
Summary
Industrial production in Japan rose for the fifth successive month in December giving further credence to Carol Stone's comment of last week: "So perhaps there is in fact room for encouragement about the state of the Japanese [...]
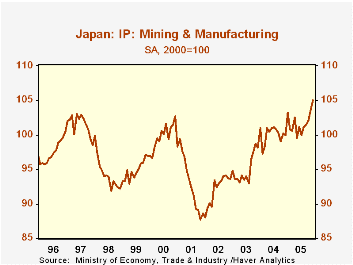
Industrial production in Japan rose for the fifth successive month in December giving further credence to Carol Stone's comment of last week: "So perhaps there is in fact room for encouragement about the state of the Japanese economy." The headline index of manufacturing and mining at 105.0 (2000=100) rose 1.4% in December and exceeded the previous peaks reached in 1997 and early 2001 as shown in the first chart.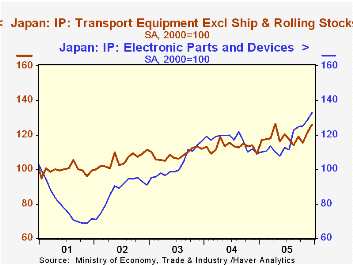
One of the fastest growing areas of Japanese manufacturing has been the Electronic Parts and Devices, followed closely by Transport Equipment (ex ships and rolling stock). These industries have shown strong growth trends throughout Japan's period of overall sluggish growth as shown in the second chart. In December, the Electronic Parts and Devices index was 32.8% above the 2000 average and 21.5% above December 2004. The Transport Equipment (ex ships and rolling stock) index was 26% above the 2000 average and 15.5% above December,2004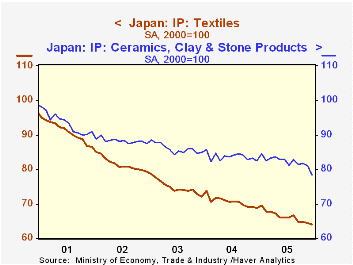
The rise of the Electronic and Transport Industries illustrates the changing structure of the Japanese economy. While these industries have grown, there has been a steady decline in the once traditional Japanese industries such as Textiles and Ceramics, Clay & Stone Products as shown in the third chart.
| Japan: Industrial Production (2000=100) | Dec 05 | Nov 05 | Dec 04 | M/M % | Y/Y % | 2005 | 2004 | 2003 |
|---|---|---|---|---|---|---|---|---|
| Manufacturing and Mining | 105.0 | 103.6 | 100.0 | 1.35 | 5.00 | 101.8 | 100.0 | 95.1 |
| Electronic parts and devices | 132.8 | 128.9 | 109.3 | 3.03 | 21.50 | 117.6 | 116.8 | 103.2 |
| Transport eqpt (ex ships and rolling stock) | 126.0 | 121.5 | 109.1 | 3.70 | 15.49 | 119.0 | 113.2 | 108.6 |
| Ceramics, clay and stone products | 78.5 | 81.0 | 82.5 | -3.09 | -4.85 | 82.2 | 83.6 | 86.0 |
| Textiles | 64.1 | 64.5 | 68.8 | -0.62 | -6.83 | 66.2 | 70.6 | 74.9 |
More Economy in Brief


