 Global| Mar 15 2010
Industrial Output Gains ModerateM/M, But Remain Broad
by:Tom Moeller
|in:Economy in Brief
Summary
Cold weather and utility demand were behind much of the gain in overall industrial output last month, but improvement elsewhere remained evident. Industrial production inched 0.1% higher after an unrevised 0.9% January gain and a [...]
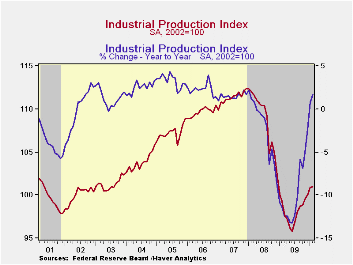
Cold weather and utility demand were behind much of the gain in overall industrial output last month, but improvement elsewhere remained evident. Industrial production inched 0.1% higher after an unrevised 0.9% January gain and a downwardly revised 0.5% December increase. The latest figure compared to a Consensus expectation for no change in output. Year-to-year improvement in output is, however, more impressive than these latest monthly results. The gain versus February of last year amounts to 1.7% and since the low last June output has risen 5.4%. These increases compare to the 9.8% decline during all of last year.
Severe weather dumped several feet of snow on the Northeast and Midwest. That necessitated another 0.5% increase in utility output which raised it 4.4% from last February. These increases followed declines last year.
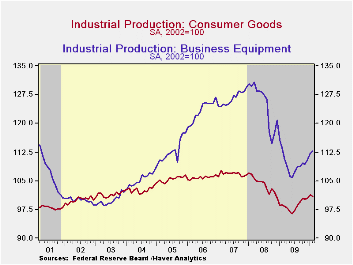
Gains in output have been about as broad-based as they get. Sixty-percent of industries posted monthly output gains, holding near the 64% level versus six months ago. In the factory sector output dipped 0.2% due primarily to a 4.5% decline (+22.9% ) in motor vehicle & parts production. That reversed a like increase during January. Elsewhere, computer (7.8% y/y), electrical equipment (-2.6% y/y) and paper (0.0% y/y) output posted monthly gains near 1.0%. Petroleum output also posted a strong 2.3% increase (-5.2% y/y). Output declined modestly in the furniture (-12.0% y/y), primary metals (+27.8% y/y) and apparel (+2.7% y/y) industries.
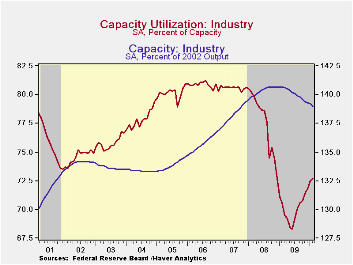
Capacity utilization rose further to 72.7%, its highest level since December 2008, from a downwardly revised 72.5% in January. In the factory sector alone utilization rose to 69.0% from the 2009 low of 65.1%. Utilization in the primary metals area has risen sharply to 62.3% from a 2009 average of 51.3%. There's also been rise in utilization in the motor vehicle sector to 52.8% from a low of 36.8% in June. Utilization was 77.0% in 2005. In the electrical equipment industry utilization rose to 72.8% from the low of 69.3% last year. The rise in overall industrial utilization was accompanied by another 0.1% m/m decline in capacity which was off a record 1.2% y/y.
The industrial production data are available in Haver's USECON database.
| Industrial Production (SA,%) | February | January | December | Y/Y | 2009 | 2008 | 2007 |
|---|---|---|---|---|---|---|---|
| Total Output | 0.1 | 0.9 | 0.5 | 1.7 | -9.8 | -2.2 | 1.5 |
| Manufacturing | -0.2 | 0.9 | -0.2 | 1.4 | -11.3 | -3.2 | 1.4 |
| Consumer Goods | -0.4 | 0.9 | 0.2 | 2.2 | -5.2 | -2.6 | 0.9 |
| Business Equipment | 0.4 | 1.5 | 1.1 | -0.7 | -12.4 | -1.1 | 2.7 |
| Construction Supplies | 0.4 | 1.1 | -2.2 | -4.5 | -17.8 | -6.3 | -2.0 |
| Materials | 0.3 | 0.8 | 0.5 | 2.9 | -10.9 | -1.9 | 2.0 |
| Utilities | 0.5 | 0.6 | 5.5 | 4.4 | -2.7 | 0.3 | 3.4 |
| Capacity Utilization (%) | 72.7 | 72.5 | 71.8 | 70.6 (Feb. '09) | 70.1 | 77.5 | 80.6 |
by Tom Moeller March 15, 2010
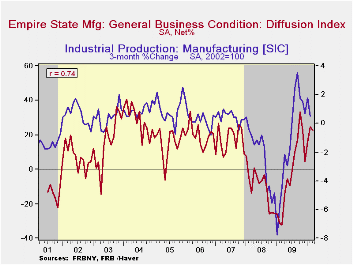
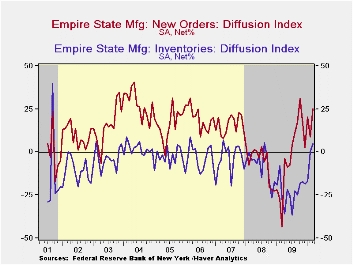
The factory sector improved again this month. The Federal Reserve Bank of New York reported that its March Empire State Factory Index of General Business Conditions held onto its sharp improvement from the series' low twelve months ago. Though down just slightly m/m, the index at 22.86 remained near the highest level since 2004. The latest level suggests positive growth in factory sector activity and it roughly matched Consensus expectations for a reading of 22.0.
The figure is a diffusion index. Since the series' inception in 2001, there has been a 74% correlation between its level and the three-month change in U.S. factory sector production. Like the Philadelphia Fed Index of General Business Conditions, the Empire State Business Conditions Index reflects answers to independent survey questions; it is not a weighted combination of the components. The series dates back only to 2001.
Amongst the separate survey questions, the new orders series led with an increase to nearly the highest level since early-2006. Most other series rose m/m, notably the inventory series which furthered the sharp February gain and landed near its highest in several years. The employment series also rose to 12.35, its highest since 2007. There has been an 87% correlation between the employment index and the three-month growth in factory sector employment as reported by the Labor Department.
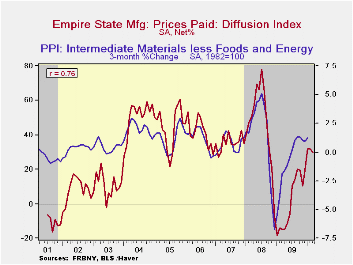
The prices paid index slipped m/m to 29.63 but remained up sharply from the early-2009 low. Since inception there has been a 76% correlation between the index of prices paid and the three-month change in the core intermediate materials PPI.
The Empire State index of expected business conditions in six months inched up m/m and was near the highest since early 2004. The capital expenditure and technology spending series both remained near the highest levels since the recession began.
| Empire State Manufacturing Survey | March | February | January | March '09 | 2009 | 2008 | 2007 |
|---|---|---|---|---|---|---|---|
| General Business Conditions (diffusion index, %) | 22.86 | 24.91 | 15.92 | -32.29 | -2.76 | -9.97 | 17.22 |
| New Orders | 25.43 | 8.78 | 20.48 | -43.35 | -2.52 | -6.22 | 15.70 |
| Inventories | 4.94 | 0.00 | -17.33 | -8.05 | -26.97 | -7.87 | -3.95 |
| Employment | 12.35 | 5.56 | 4.00 | -38,20 | -17.28 | -5.36 | 11.28 |
| Prices Paid | 29.63 | 31.94 | 32.00 | -14.61 | 1.33 | 46.99 | 35.64 |
by Tom MoellerMarch 15, 2010
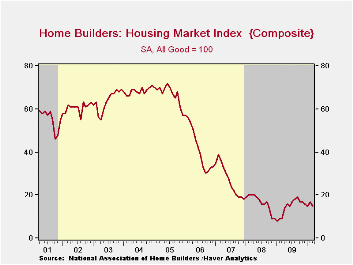
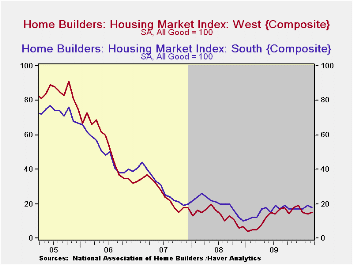
Poor weather in much of the country likely affected housing market activity during 1Q. The National Association of Home Builders' index of housing market activity fell this month to 15 from 17 in February and for 1Q the index's average level was the lowest since 2Q '09. Nevertheless, the index remained double the low of 8 hit last January. The index is compiled from survey questions asking builders to rate market conditions as “good”, “fair”, “poor” or “very high” to “very low”. The figure is thus a diffusion index with numerical results over 50 indicating a predominance of “good” readings.
The present sales index fell m/m to 15 from 17 and for the second quarter also was the lowest since 2Q '09. The index of sales during the next six months also deteriorated to the lowest level since April of last year.The Home Builders' Association also reported that the traffic of prospective buyers fell to the lowest level in twelve months.
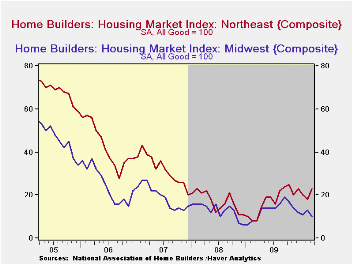
Supporting the notion of a strong weather factor was a sharp decline in the Builders' index for the Midwest and in Northeast for 1Q. In the South the index showed gains of one-quarter versus last year during 1Q. The index for the West slipped through the quarter but remained double the year-ago level.
The Home Builders' Housing Opportunity Index, which is the share of homes sold that could be considered affordable to a family earning the median income, slipped during 4Q '09 (the latest available figure) to 70.8%. It had jumped earlier to a record high of 72.5% buoyed by lower home prices, lower interest rates and higher income. (There is a break in the series from 2002 to 2003.)
| Nat'l Association of Home Builders | March | February | January | March '09 | 2009 | 2008 | 2007 |
|---|---|---|---|---|---|---|---|
| Composite Housing Market Index (All Good=100) | 15 | 17 | 15 | 9 | 15 | 16 | 27 |
| Single-Family Sales | 15 | 17 | 15 | 8 | 13 | 16 | 27 |
| Single-Family Sales: Next Six Months | 24 | 27 | 26 | 15 | 24 | 25 | 37 |
| Traffic of Prospective Buyers | 10 | 12 | 12 | 9 | 13 | 14 | 21 |
by Robert Brusca March 15, 2010
Japan with one of the world’s most entrenched recessions produced some absolutely glowing consumer results for January. If Japanese consumers can break out of their doldrums, maybe, -just maybe- there is still hope for Germany and for Europe.
Also for the first time in EIGHT MONTHS the Japanese government raised its assessment of the economy, saying the recovery is beginning to spur profits, home building and consumer spending.
“The economy has been picking up steadily,” though it remains in a “difficult situation” because of high unemployment. This statement was from Japan’s key the Cabinet Office which said today in its report for March that the rebound is still weak. Still, it is a hopeful remark and Japan’s retail sales underscore that at least one undercurrent of good news has broken though to at least one important headline.
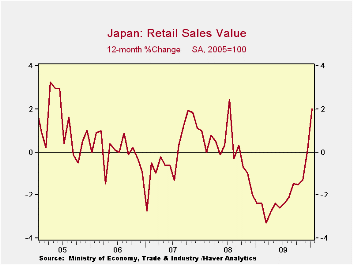
Japan’s seasonally adjusted headline for retail sales shows an acceleration to a growth rate of 7.1% over three-months compared to 4.5% over six months and 2% over 12 months. These are huge accelerations especially from -9.2% for the year end one year ago in January 2009.
Japan’s acceleration in retail sales is in retrospect remarkable. We are always looking at the level of the growth rate and for Japan that has been persistently negative. Moreover, Yr/Yr calculations that are slower to turnaround tend to dominate analysis. But Japan has come a long way on that measure too, to a 2% growth rate in Jan 2010 compared to a minus 9.2% for the same Yr/Yr rate in Jan 2009. To be able to post a three-month annualized growth rate of seven percent in this environment is excellent and remarkable.
The cabinet office interpretation is putting its stamp of approval on this improvement and a stamp of expected longevity on the rebound itself.
| Japan Retail Sales Trends | ||||||||
|---|---|---|---|---|---|---|---|---|
| Jan-10 | Dec-09 | Nov-09 | 3-mo | 6-mo | 12-mo | Yr-Ago | Q-to-Date | |
| Total SA | 2.0% | -0.3% | 0.0% | 7.1% | 4.5% | 2.0% | -9.2% | 11.5% |
| Not seasonally adjusted | ||||||||
| Total: Nominal | 2.4% | -0.2% | 0.0% | 8.7% | 5.4% | 2.2% | -10.1% | 14.0% |
| Motor Vehicles | 2.5% | -2.2% | 4.2% | 18.8% | 18.6% | 14.0% | -10.1% | 14.9% |
| Food& Beverage | 5.1% | -1.1% | -0.8% | 13.3% | 4.5% | 1.3% | 10.7% | 27.3% |
| Fabric apparel & access | 3.1% | 0.8% | 1.6% | 24.5% | 10.8% | 6.3% | -16.5% | 28.0% |
| Rest of Retail | 0.5% | 0.7% | -0.9% | 1.2% | 2.0% | -0.6% | -20.1% | 4.0% |
by Louise Curley March 15, 2010
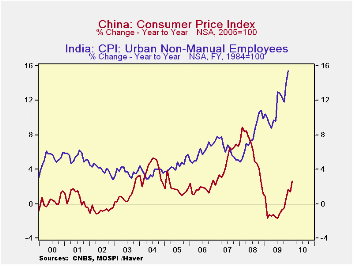
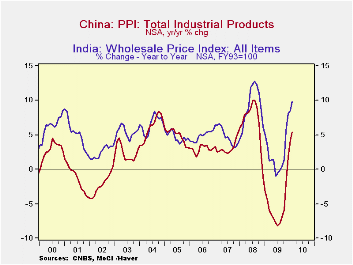
Rapid recovery from the recession in the emerging countries of the Pacific Rim is putting pressure on consumer and wholesale prices, notably in India and China. Data on inflation for the two countries can be found in Haver Analytics' EMERGEPR data base. In February, the year to year increase in China's CPI--the measure of inflation-- was 2.66%. There has been an almost steady rise form the last July when prices were 1.68% below the year ago figure. Inflation is much higher in India. The most up to date inflation data for India are the January, 2010 inflation rates for Industrial, Agricultural and Rural Workers, which were 16.22%, 17.57% and 17.35% respectively. The latest date for the General Index, an overall index, is December, 2009 when the inflation rate was 15.47%. Consumer prices in the two countries are shown in the first chart.
| Feb 10 | Jan 10 | Dec 09 | Nov 08 | Oct 09 | Sep 09 | Aug 09 | Jul 09 | |
|---|---|---|---|---|---|---|---|---|
| China | ||||||||
| Y/Y % CHANGE IN CPI | 2.66 | 1.42 | 1.70 | 0.50 | -0.53 | -0.71 | -1.06 | -1.68 |
| Y/Y% CHANGE IN PPI | 5.40 | 4.30 | 1.70 | -2.08 | -5.80 | -6.95 | -7.95 | -8.20 |
| India | ||||||||
| Y/Y % CHANGE IN CPI General Index | N/A | N/A | 15.47 | 13.91 | 11.83 | 12.39 | 12.88 | 13.04 |
| Y/Y % CHANGE IN CPI Industrial Workers | N/A | 16.22 | 14.97 | 13.51 | 11.49 | 11.64 | 11.72 | 11.89 |
| Y/Y % CHANGE IN CPI Agric Workers | N/A | 17.57 | 17.21 | 15.65 | 13.73 | 13.18 | 12.89 | 12.90 |
| Y/Y % CHANGE IN CPI Rural Workers | N/A | 17.35 | 16.99 | 15.65 | 13.51 | 12.97 | 12.67 | 12.67 |
| Y/Y% CHANGE IN WPI | 9.89 | 8.56 | 8.10 | 5.55 | 1.41 | -0.46 | -0.17 | -0.54 |

Tom Moeller
AuthorMore in Author Profile »Prior to joining Haver Analytics in 2000, Mr. Moeller worked as the Economist at Chancellor Capital Management from 1985 to 1999. There, he developed comprehensive economic forecasts and interpreted economic data for equity and fixed income portfolio managers. Also at Chancellor, Mr. Moeller worked as an equity analyst and was responsible for researching and rating companies in the economically sensitive automobile and housing industries for investment in Chancellor’s equity portfolio. Prior to joining Chancellor, Mr. Moeller was an Economist at Citibank from 1979 to 1984. He also analyzed pricing behavior in the metals industry for the Council on Wage and Price Stability in Washington, D.C. In 1999, Mr. Moeller received the award for most accurate forecast from the Forecasters' Club of New York. From 1990 to 1992 he was President of the New York Association for Business Economists. Mr. Moeller earned an M.B.A. in Finance from Fordham University, where he graduated in 1987. He holds a Bachelor of Arts in Economics from George Washington University.
More Economy in Brief


