 Global| Jul 20 2004
India's Trade Deficit Sets a Record in June
Summary
The Government of India today reported June trade data. The monthly deficit widened significantly to 117 billion rupees (seasonally adjusted by Haver Analytics) from 65 billion rupees in May. A surge in imports was the cause, although [...]
The Government of India today reported June trade data. The monthly deficit widened significantly to 117 billion rupees (seasonally adjusted by Haver Analytics) from 65 billion rupees in May. A surge in imports was the cause, although both imports and exports are growing rapidly and stand more than 30% ahead of a year ago.
A striking aspect of this information for us is that India runs a trade deficit at all, much less the record amount recorded for June. Anecdotal evidence emphasizes the role of outsourcing, giving one the impression that trade must be in surplus. That is clearly incorrect. However, we would surmise that a good part of Indian imports consists of components used in production of Indian exports. The deep erosion of the trade balance has occurred in just the last year, and that development might suggest that energy prices play some role as well in the onrush of imports.
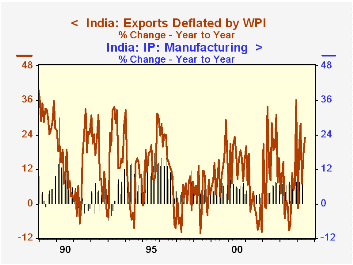
At the same time, Indian exports are strong. And the Indian manufacturing sector surely must derive considerable boost from foreign demand. We examined this proposition using some simple analysis with DLXVG3 software. Industrial production is, of course, a volume measure, so we deflated merchandise exports to express them in volume terms. We used the wholesale price index for India as our deflator. Year-on-year growth rates in the resulting export volume and in industrial production in manufacturing are shown in the accompanying graph. Correlation of the levels of these measures is a whopping 97% over the last 15 years. But the 12-month growth rates have little correlation. Still, the appearance of the graph give a strong hint that export growth is a driving force of industrial production in India.
| June 2004 | May 2004 | Apr 2004 | Year Ago | 2003 | 2002 | 2001 | |
|---|---|---|---|---|---|---|---|
| Balance, Billion Rupees | -117.20 | -65.43 | -54.56 | -70.64 | -662.86 | -352.78 | -340.21 |
| Exports, Mo/Mo % Chg | 3.4 | 4.9 | -15.4 | 30.9 | 10.6 | 18.5 | 5.8 |
| Imports, Mo/Mo % Chg | 18.7 | 7.6 | -1.0 | 39.3 | 20.6 | 16.3 | 5.2 |
Carol Stone, CBE
AuthorMore in Author Profile »Carol Stone, CBE came to Haver Analytics in 2003 following more than 35 years as a financial market economist at major Wall Street financial institutions, most especially Merrill Lynch and Nomura Securities. She had broad experience in analysis and forecasting of flow-of-funds accounts, the federal budget and Federal Reserve operations. At Nomura Securities, among other duties, she developed various indicator forecasting tools and edited a daily global publication produced in London and New York for readers in Tokyo. At Haver Analytics, Carol was a member of the Research Department, aiding database managers with research and documentation efforts, as well as posting commentary on select economic reports. In addition, she conducted Ways-of-the-World, a blog on economic issues for an Episcopal-Church-affiliated website, The Geranium Farm. During her career, Carol served as an officer of the Money Marketeers and the Downtown Economists Club. She had a PhD from NYU's Stern School of Business. She lived in Brooklyn, New York, and had a weekend home on Long Island.
More Economy in Brief


