 Global| Dec 18 2007
In Spite of Lower than Expected Inflation in Canada and the Uk in November, Stagflation Fears Are Rising
Summary
Both Canada and the United Kingdom reported lower than expected core inflation for November. In Canada, core inflation excluding food and energy was 1.76% while headline inflation was 2.47%. In the UK, comparable figures were 1.47% [...]
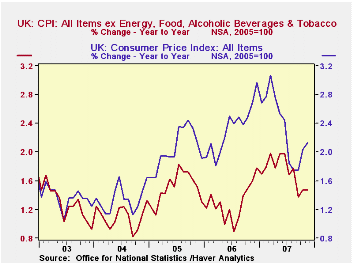
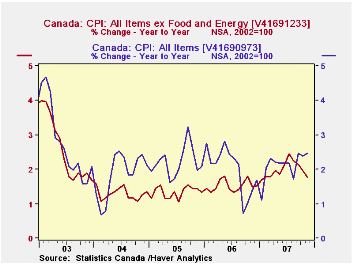
Both Canada and the United Kingdom reported lower than expected core inflation for November. In Canada, core inflation excluding food and energy was 1.76% while headline inflation was 2.47%. In the UK, comparable figures were 1.47% and 2.13%. Core and headline inflation rates for the U.K. and Canada are shown in the first and second charts. In the United States, on the other hand, the November rises in the core and headline inflation rates, announced earlier, were greater than expected. The core inflation rate was 2.33% and the headline 4.31%. Fears of stagflation--slow or no growth and inflation--are being surfacing. Former Federal Reserve Board Chairman, Greenspan, speaking on ABC's "This Week" program on December 15, said "We are beginning to get not stagflation, but the early symptoms of it."
Core inflation, usually defined as headline inflation excluding energy and food, is frequently the target of a Central Bank's monetary policy. Over time, the theory goes, rises or falls in the prices of food and energy tend to be offset by subsequent falls or rises in these prices. Exclusion of these items gives a better picture of underlying inflation. However, there are times when it may be prudent to focus not on core inflation but on the broader headline inflation. In stagflation it is the headline series that matters. The current rise in commodity prices is due less to a cyclical shortage of supply that will be corrected by a cyclical increase in production in the coming months than it is to a structural shift in world demand for food and energy, engendered, in large part, by the rapid growth of the emerging economies, especially, China. Yesterday, December 17, for example, the price of a bushel of wheat almost reached $10, its highest price on record. Soybeans also marked a record at $11.14 a bushel. Even the price of corn, which had declined earlier in the year was up to $4.10 on December 17. The daily prices of corn, wheat and soybeans over the last two years are shown in the third chart.

| INFLATION RATES | Nov 07 | Oct 07 | Nov 06 | M/M %Chg | Y/Y %Chg | 2006 | 2005 | 2004 |
|---|---|---|---|---|---|---|---|---|
| U.K. Headline (2005=100) | 105.6 | 105.3 | 103.4 | 0.28 | 2.13 | 102.3 | 100.0 | 98.0 |
| U.K. Core | 103.6 | 103.5 | 102.1 | 0.10 | 1.47 | 101.3 | 100.0 | 98.5 |
| Canada Headline (2002=100) | 111.9 | 111.6 | 109.2 | 0.27 | 2.47 | 109.1 | 107.0 | 104.7 |
| Canada Core | 109.6 | 109.6 | 107.7 | 0.00 | 1.76 | 106.9 | 105.3 | 103.9 |
| U. S. Headline (1982-84=100) | 210.2 | 208.9 | 201.5 | 0.59 | 4.31 | 201.6 | 195.3 | 188.9 |
| U. S. Core | 212.4 | 212.3 | 207.6 | 0.06 | 2.33 | 205.9 | 200.9 | 196.6 |
More Economy in Brief


