 Global| Mar 15 2006
Import Prices Back Down
by:Tom Moeller
|in:Economy in Brief
Summary
One month U.S. import prices move up, the next month they're down. And sometimes, they remain unchanged. All three possibilities have been in evidence since last November. The trend is up but the rate of increase appears to have [...]
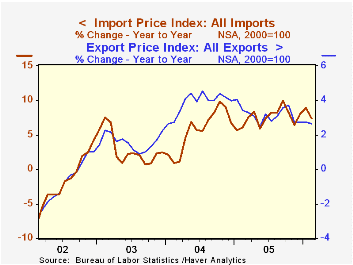
One month U.S. import prices move up, the next month they're down. And sometimes, they remain unchanged. All three possibilities have been in evidence since last November. The trend is up but the rate of increase appears to have topped, but for how long? Last month, total import prices fell an expected 0.5% after a revised 1.4% jump during January.
Nonpetroleum import prices dropped 0.5% during February and reversed the upwardly revised 0.3% January rise. The fall reflected lower prices of foods, feeds and beverages where a 1.7% decline (+4.1% y/y) reversed much of the prior two months' strength. Industrial materials prices less petroleum also fell a sharp 2.2% (+9.9% y/y) due to a 19.2% m/m decline in natural gas prices (+40.8% y/y). 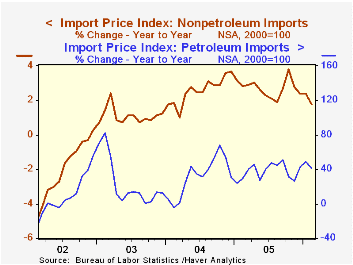
Prices for nonauto consumer goods were unchanged (-0.4% y/y) for the second month in the last three but capital goods prices rose 0.2% (-1.3% y/y). Excluding a 0.1% decline in computer prices (-6.4% y/y), capital goods prices rose 0.4% (1.0% y/y). Motor vehicle & parts prices rose 0.1% (0.4% y/y).
Petroleum prices also reversed course last month and fell 0.7% after a 6.9% spike during January. Crude oil prices dipped 0.9% (39.95 y/y) after an 8.7% spike during January. So far in March the price of Brent Crude has averaged $60.80 versus $60.19 per bbl. during February.
During the last ten years there has been a 66% (negative) correlation between the nominal trade-weighted exchange value of the US dollar vs. major currencies and the y/y change in non oil import prices. The correlation is a lower 47% against a broader basket of currencies and a lower 57% against the real value of the dollar.
Export prices were unchanged m/m and the 2.6% y/y gain was below the increases of 2004 and 2005.
| Import/Export Prices (NSA) | Feb | Jan | Y/Y | 2005 | 2004 | 2003 |
|---|---|---|---|---|---|---|
| Import - All Commodities | -0.5% | 1.4% | 7.4% | 7.5% | 5.6% | 2.9% |
| Petroleum | -0.7% | 6.9% | 40.8% | 37.6% | 30.5% | 21.0% |
| Non-petroleum | -0.5% | 0.3% | 1.8% | 2.7% | 2.6% | 1.1% |
| Export - All Commodities | 0.0% | 0.7% | 2.6% | 3.2% | 3.9% | 1.6% |
by Tom Moeller March 15, 2006
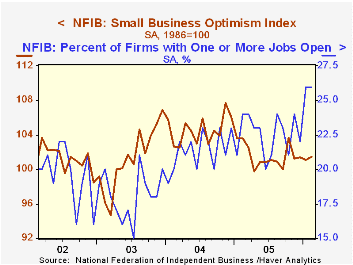
The February index of small business optimism from the National Federation of Independent Business (NFIB) reversed all the prior month's decline and rose 0.4%. The index has moved generally sideways since last Fall.
The percentage with one or more job openings held at the high level of 26% reached in January. That is the highest since 2001.In addition, the percentage of firms planning to increase employment at 16% was down just one point from January but remained higher than the averages of the last five years.
The percent planning to raise capital expenditures rose to 35%, the highest level in nearly a year. Despite these plans the percent of firms expecting the economy to improve slid to just 3%, the lowest level since 2001. 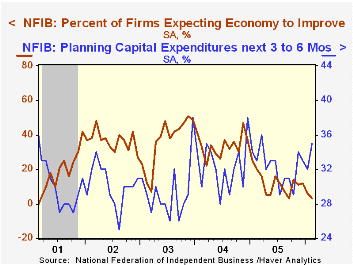
During the last ten years there has been a 70% correlation between the level of the NFIB index and the two quarter change in real GDP.
The percentage of firms planning to raise average selling prices slipped to 27%, the same as during all of last year but the percentage of firms actually raising average selling prices rose to 23%, a bit higher than last year. During the last ten years there has been a 60% correlation between the change in the producer price index and the level of the NFIB price index.
About 24 million businesses exist in the United States. Small business creates 80% of all new jobs in America.
| Nat'l Federation of Independent Business | Feb | Jan | Y/Y | 2005 | 2004 | 2003 |
|---|---|---|---|---|---|---|
| Small Business Optimism Index (1986=100) | 101.5 | 101.1 | -2.0% | 101.6 | 104.6 | 101.3 |
by Tom Moeller March 15, 2006
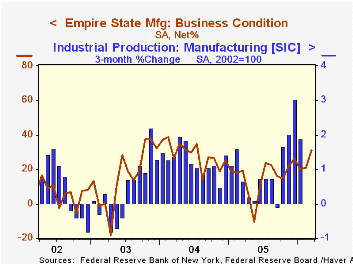
The Empire State Index of General Business Conditions for March, published by the Federal Reserve Bank of New York, surged to 31.16 from a revised 21.02 last month. Consensus expectations for the factory sector index had been for a decline to 18.8.
Since the series' inception in 2001 there has been a 76% correlation between the index level and the three month change in factory sector production.
Most of the index components improved in March. The employment index jumped to 21.75, the highest level since the middle of last year while the shipments index similarly surged. New orders also improved and the inventory index jumped to the highest level since late 2001.
Pricing pressure eased, indicated by sharp drop in the index to the lowest level since last August.
Like the Philadelphia Fed Index of General Business Conditions, the Empire State Business Conditions Index reflects answers to an independent survey question; it is not a weighted combination of the components.
The index of expectations for business conditions in six months rose very slightly m/m and expectations for future capital spending fell.
The Empire State Manufacturing Survey is a monthly survey of manufacturers in New York State conducted by the Federal Reserve Bank of New York. Participants from across the state in a variety of industries respond to a questionnaire and report the change in a variety of indicators from the previous month. Respondents also state the likely direction of these same indicators six months ahead. April 2002 is the first report, although survey data date back to July 2001.
For more on the Empire State Manufacturing Survey, including methodologies and the latest report, click here.
| Empire State Manufacturing Survey | Mar | Feb | Mar '05 | 2005 | 2004 | 2003 |
|---|---|---|---|---|---|---|
| General Business Conditions (diffusion index) | 31.16 | 21.02 | 19.30 | 15.56 | 28.79 | 15.98 |
by Tom Moeller March 15, 2006
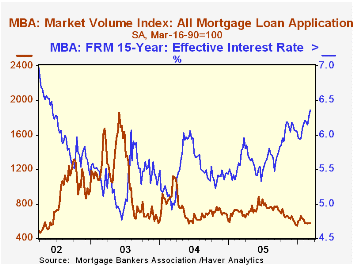
The total number of mortgage applications slipped 0.2% following a 0.7% increase the prior week. In March, applications are 1.9% below the February average which fell 6.3% m/m.
The effective interest rate on a conventional 30-year mortgage jumped for the second week. The nine basis point rise in the effective rate on a 15-year mortgage to 6.36% was to the highest level since mid-2002. The ten basis point rise in the effective rate on a 30 year mortgage pulled it to 6.65%. Interest rates on 15 and 30 year mortgages are closely correlated (>90%) with the rate on 10 year Treasury securities and during the last ten years there has been a (negative) 82% correlation between purchase applications and the effective rate on a 30-Year mortgage.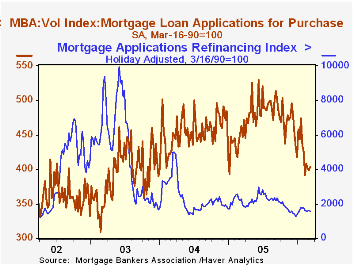
Purchase applications rose for the first week in three, by 1.0%. The March level is down 1.4% from the February average.
During the last ten years there has been a 50% correlation between the y/y change in purchase applications and the change in new plus existing single family home sales.
Applications to refinance retraced most of the prior week's rise and fell 1.9%. The March level is 2.1% below the February average which fell 2.0% from January.
The Mortgage Bankers Association surveys between 20 to 35 of the top lenders in the U.S. housing industry to derive its refinance, purchase and market indexes. The weekly survey accounts for more than 40% of all applications processed each week by mortgage lenders. Visit the Mortgage Bankers Association site here.
| MBA Mortgage Applications (3/16/90=100) | 03/10/06 | 03/03/06 | Y/Y | 2005 | 2004 | 2003 |
|---|---|---|---|---|---|---|
| Total Market Index | 574.4 | 575.6 | -21.1% | 708.6 | 735.1 | 1,067.9 |
| Purchase | 403.0 | 399.0 | -12.9% | 470.9 | 454.5 | 395.1 |
| Refinancing | 1,583.6 | 1,614.4 | -30.2% | 2,092.3 | 2,366.8 | 4,981.8 |
by Carol Stone March 15, 2006
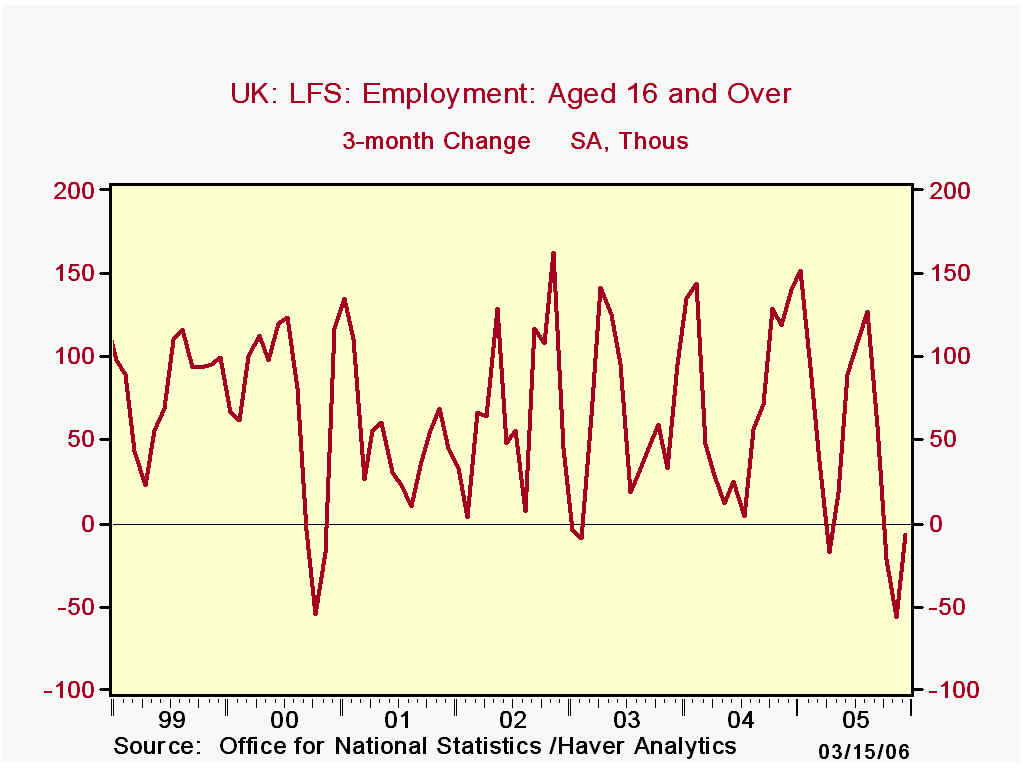
Since we last reported on the UK labor market here in mid-January, conditions have continued to soften. Measured by 3-month centered moving averages, employment and unemployment have both deteriorated. In the December period (November, December and January), employment was off 7,000 from three months before (the usual UK comparison), following a 56,000 decline in the November period and 22,000 in October.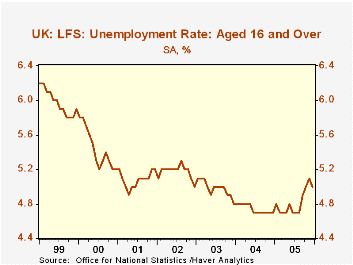 The unemployment rate reached 5.1% in the November period and edged lower in December to 5.0%. It had averaged 4.8% for all of 2005.
More current data on claims for unemployment benefits and job vacancies point toward further possible labor market softening. The so-called "claimant count" shows that 919,700 people were collecting benefits in February, up from 901,900 in December and an average of 861,100 for 2005. The number of job vacancies is decreasing, pointing to fewer new opportunities for work: there were 610,700 reported vacancies in February, down from 627,900 in December and 626,700 for all of 2005. Other indicators of less-than-full participation in employment are also showing negative patterns. The number of employees who are working part-time because they can't find full-time work is rising. And the number of temporary workers who are working "temp" because they can't find permanent work has been ratcheting upward for several months.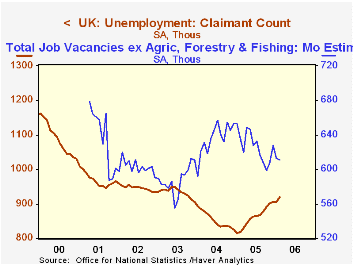
Finally, as might be expected from a pattern of diminished demand for labor, workers' earnings are remaining on soft side. The headline series* for the average earnings index was 3.5% in January, flat with December and down from 4.0% in 2005 and 4.5% in 2004.
| United Kingdom | Feb 2006 | Jan 2006 | Dec 2005 | Nov 2005 | 2005 | 2004 | 2003 |
|---|---|---|---|---|---|---|---|
| Employment (3Mo Avg, SA, Thous) | -- | -- | 28,806 | 28,769 | 28,743 | 28,465 | 28,183 |
| Chg from 1 & 3 Months Ago | -- | -- | +37/-7 | +5/-56 | 1.0 | 1.0 | 1.0 |
| Unemployment Rate (3Mo Avg, SA, %) |
-- | -- | 5.0 | 5.1 | 4.8 | 4.8 | 5.0 |
| Claimant Count (Monthly, Thous) | 919.7 | 905.1 | 906.2 | 901.9 | 861.1 | 853.6 | 933.3 |
| Vacancies (Monthly, Thous) | 610.7 | 612.9 | 627.9 | 607.6 | 626.7 | 635.5 | 587.4 |
| Average Earnings Index inc Bonus (Headline Rate*) | -- | 3.5 | 3.5 | 3.4 | 4.0 | 4.5 | 3.4 |

Tom Moeller
AuthorMore in Author Profile »Prior to joining Haver Analytics in 2000, Mr. Moeller worked as the Economist at Chancellor Capital Management from 1985 to 1999. There, he developed comprehensive economic forecasts and interpreted economic data for equity and fixed income portfolio managers. Also at Chancellor, Mr. Moeller worked as an equity analyst and was responsible for researching and rating companies in the economically sensitive automobile and housing industries for investment in Chancellor’s equity portfolio. Prior to joining Chancellor, Mr. Moeller was an Economist at Citibank from 1979 to 1984. He also analyzed pricing behavior in the metals industry for the Council on Wage and Price Stability in Washington, D.C. In 1999, Mr. Moeller received the award for most accurate forecast from the Forecasters' Club of New York. From 1990 to 1992 he was President of the New York Association for Business Economists. Mr. Moeller earned an M.B.A. in Finance from Fordham University, where he graduated in 1987. He holds a Bachelor of Arts in Economics from George Washington University.
More Economy in Brief


