 Global| Sep 17 2009
Housing Starts Show Turns AcrossRegions
Summary
Yr/Yr regional housing markets all are still declining, of course, but the pace of the drop is diminishing across each of the main regions. The turn is clear but to keep it in gear will require more growth. With the first time home [...]
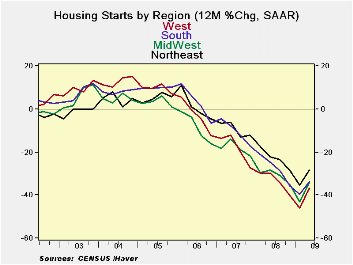
Yr/Yr regional housing markets all are still declining, of
course, but the pace of the drop is diminishing across each of the main
regions. The turn is clear but to keep it in gear will require more
growth. With the first time home buyer incentives coming off, home
purchases will find a greater challenge to hold the uptrend. It is a
good time to hold our breath and to wait and see how much of this turn
remains in place. Hopefully with the incentives off, a stronger economy
will provide the incentive for a lasting rebound in housing starts.
The table shows that the strength of the housing rebound is in
the single family sector where these purchase incentives play strongly.
For single family units, current strength is building momentum and
permits are steadily strengthening as well, despite the date with the
expiration for incentives.
The 2-4 unit sector is falling at an accelerated pace. Permits
are showing some lift nonetheless. Multifamily starts are still very
weak and despite that permits are improving.
Still the story of housing this month is that it was buoyed by
gains in the multifamily sector even though that sector has weak
trends. Single family starts fell sharply in the month. The small 2-4
unit sector also fell. This month growth was propped up by the sector
that has showed the least promise. The homebuilder survey released on
Sept 16th showed a one –point rise in that index. For the time being
housing retains its upward momentum, however slight.
| Housing Starts/Permits By Unit Size | ||||||||
|---|---|---|---|---|---|---|---|---|
| Analytical Comparisons (Pct. Changes-Not Compounded) | ||||||||
| Aug.2009 | ||||||||
| Total | One Unit | 2-4 Units | 5 or more | |||||
| In 000's of Units | Starts | Permits | Starts | Permits | Starts | Permits | Starts | Permits |
| This Month:Saar | 598 | 579 | 479 | 462 | 4 | 19 | 115 | 98 |
| Jul.2009 | 589 | 564 | 494 | 463 | 10 | 18 | 85 | 83 |
| Jun.2009 | 590 | 570 | 478 | 433 | 11 | 23 | 101 | 114 |
| 3-month avg. | 592 | 571 | 484 | 453 | 8 | 20 | 100 | 98 |
| 1-month % chg. | 1.5% | 2.7% | -3.0% | -0.2% | -60.0% | 5.6% | 35.3% | 18.1% |
| 3-month % chg | 8.5% | 11.8% | 17.1% | 13.8% | -55.6% | 5.6% | -13.5% | 4.3% |
| 6-month % chg | 4.2% | 5.3% | 34.2% | 21.3% | -69.2% | 11.8% | -43.6% | -35.5% |
| yr/yr % chg. | -29.6% | -32.4% | -21.7% | -15.7% | -73.3% | -44.1% | -48.2% | -64.4% |
| Drop from Max | -73.7% | -74.4% | -73.7% | -74.3% | -95.2% | -82.1% | -73.6% | -81.6% |
Euro Trade Surplus Surges
by Robert Brusca September 17, 2009
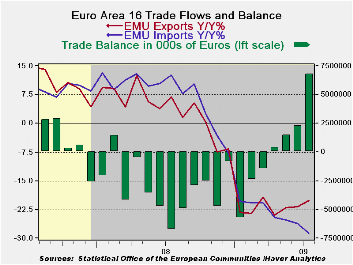
Exports rose sharply in the e-Zone in July posting a gain of
4.1% in the month as imports edged lower by 0.3%. The widening surplus
will boost EMU GDP and surpluses have emerged and steadily widened over
the last four months. The chart shows a considerable trend in place
with exports rising and imports still extending their losses in
percentage terms.
Among export components raw material are having the largest
export boom over the previous three months (detailed trade data lag one
month). But even over that period MFG exports are falling at an 8.6%
pace. On the import side imports continue to post negative growth rates
even over three-months. Raw material imports are falling sharply on
that period. And manufacturing imports are falling at nearly
three-times the pace of MFG exports.
| Ezone 13-Trade trends for goods | |||||
|---|---|---|---|---|---|
| m/m% | % Saar | ||||
| Jul-09 | Jun-09 | 3M | 6M | 12M | |
| Balance* | €€ 6,777 | €€ 2,288 | €€ 3,514 | €€ 1,181 | €€ (1,230) |
| Exports | |||||
| All Exp | 4.1% | 0.9% | 14.2% | 8.6% | -20.1% |
| Food and Drinks | -- | 0.6% | 5.7% | -15.0% | -9.1% |
| Raw materials | -- | -0.2% | 84.5% | 8.4% | -21.8% |
| MFG | -- | -1.6% | -8.6% | -27.9% | -24.1% |
| IMPORTS | |||||
| All IMP | -0.3% | 0.2% | -10.7% | -14.5% | -28.7% |
| Food and Drinks | -- | -0.9% | -8.2% | -13.8% | -7.9% |
| Raw materials | -- | 0.3% | -49.4% | -58.0% | -41.2% |
| MFG | -- | -2.0% | -31.2% | -28.9% | -22.8% |
| *Eur mlns; mo or period average; Gray shaded areas lag one month | |||||
U.S. Leading Indicators Rise ForAFifth Straight Month And Signal Economic Recovery
by Tom Moeller September 21, 2009
 Extraordinary
developments continued to characterize the US financial system through
Q2, as indicated in the Federal Reserve's flow-of-funds accounts,
published today at noon. Two sectors in particular caught our
attention, households and the federal government, each for opposing
reasons.
Extraordinary
developments continued to characterize the US financial system through
Q2, as indicated in the Federal Reserve's flow-of-funds accounts,
published today at noon. Two sectors in particular caught our
attention, households and the federal government, each for opposing
reasons.
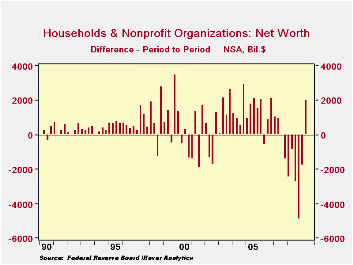
First, after six consecutive quarters of deterioration, household net worth finally experienced an improvement. It increased $2.0 trillion to $53.1 trillion. The biggest gains came from the upturn in the stock market, which added $1.1 trillion to people's assets. Additionally, mutual fund holdings gained $486 billion, and pension fund reserves -- largely invested in equities, of course -- added $742 billion. Among tangible assets, household real estate values rose by $323 billion following nine consecutive quarters of erosion.
Household financial positions also improved because they continued to pay down liabilities. These changes were small compared to the asset moves, but clearly still in a favorable direction; total liabilities fell $35 billion in Q2, the fourth reduction in the last five quarters. Mortgage debt and consumer credit had the largest declines, while conventional bank loans increased.
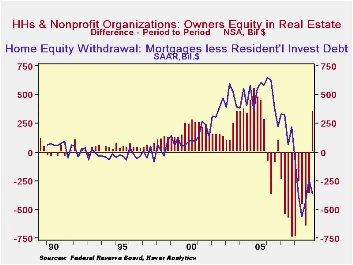
In these comparisons, the concept of "mortgage equity
withdrawal" plays a role. Homeowners' equity in real estate
increased in Q2 by $353 billion. It had contracted in 12 of
the last 13 quarters, a span extending back to the beginning of 2006
and interrupted by just a token increase in Q4 2006. For the
first year of this period, the reductions were evidently deliberate on
the part of consumers, who borrowed heavily against their
properties. Such "mortgage equity withdrawal" became a
popular addition to economists' tools for forecasting consumer
spending, which could be larger still when income was augmented by
liquidations of home values. This practice dwindled rapidly
however as real estate prices began to decline in 2007 and according to
the Haver measure, "MEW" turned negative last year. So people
began borrowing a smaller portion of the value of the real estate they
were purchasing or remodeling to try to hold a larger equity
stake. In the aggregate this effort was subverted by the the
continuing decline in real estate prices in general.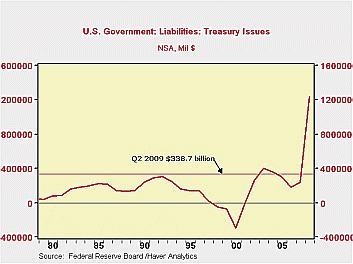 Finally,
though, this last quarter saw homeowners' equity go up. As
noted above, the value of real estate increased some $323
billion. Our measure of MEW declined by about $90 billion,
and mortgage debt itself was paid down by some $29 billion.
As a media headline writer noted recently, once again, the main
function of a home is returning to that of residence, not a resource to
pay for something else.
Finally,
though, this last quarter saw homeowners' equity go up. As
noted above, the value of real estate increased some $323
billion. Our measure of MEW declined by about $90 billion,
and mortgage debt itself was paid down by some $29 billion.
As a media headline writer noted recently, once again, the main
function of a home is returning to that of residence, not a resource to
pay for something else.
Separately in this flow-of-funds report, we were also struck by the magnitude of the federal government's borrowing, and just one small comparison will suffice to illustrate. In these data, it's the historical comparison available through the time series that helps put these things in perspective. It's easy to joke about "a trillion here and trillion there", but here's a new way to look at these numbers. In Q2, net new issues of Treasury securities were just under $339 billion. In this one three-month period, at a time of year when tax inflows usually mean the Treasury borrows little or even pays down on the debt, the Treasury borrowed more than it had in any whole year before 2003. And this latest quarter's new debt was in fact seasonally small: the prior three quarters had averaged $518 billion, easily larger than any whole year ever -- until 2008.
| Flow of Funds (Y/Y % Chg.) | % of Total Outstanding | 2Q '09 | 1Q '09 | End of Year | ||
|---|---|---|---|---|---|---|
| 2008 | 2007 | 2006 | ||||
| Total Credit Market Debt Outstanding | -- | 3.0 | 4.2 | 5.0 | 10.4 | 9.8 |
| Federal Government | 13.6% | 35.9 | 28.3 | 24.2 | 4.9 | 3.9 |
| Households | 25.9% | -1.2 | -0.7 | 0.3 | 6.6 | 10.0 |
| Nonfinancial Corporate Business | 13.8% | 2.9 | 4.4 | 5.3 | 14.2 | 8.4 |
| Nonfarm, Noncorporate Business | 6.9% | -1.7 | 1.4 | 4.9 | 12.6 | 14.7 |
| Financial Sectors | 31.3% | -0.9 | 3.7 | 5.5 | 13.4 | 9.9 |
| Trillions of $ | ||||||
| Net Worth: Households & Nonprofit Organizations | -- | $53.140 | $51.141 | $52.917 | $62.911 | $63.335 |
| Tangible Assets: Households | -- | $24.847 | $24.660 | $25.177 | $27.526 | $28.724 |
| Financial Assets: Households | -- | $42.361 | $40.584 | $41.957 | $50.703 | $48.025 |
| Total Liabilities: Households | -- | $14.068 | $14.103 | $14.217 | $14.318 | $13.414 |

Robert Brusca
AuthorMore in Author Profile »Robert A. Brusca is Chief Economist of Fact and Opinion Economics, a consulting firm he founded in Manhattan. He has been an economist on Wall Street for over 25 years. He has visited central banking and large institutional clients in over 30 countries in his career as an economist. Mr. Brusca was a Divisional Research Chief at the Federal Reserve Bank of NY (Chief of the International Financial markets Division), a Fed Watcher at Irving Trust and Chief Economist at Nikko Securities International. He is widely quoted and appears in various media. Mr. Brusca holds an MA and Ph.D. in economics from Michigan State University and a BA in Economics from the University of Michigan. His research pursues his strong interests in non aligned policy economics as well as international economics. FAO Economics’ research targets investors to assist them in making better investment decisions in stocks, bonds and in a variety of international assets. The company does not manage money and has no conflicts in giving economic advice.
More Economy in Brief


