 Global| Dec 19 2006
Housing Starts Recover A Bit
by:Tom Moeller
|in:Economy in Brief
Summary
November housing starts recovered less than half of the previous month's little revised decline with a 6.7% increase. The gain to 1.588M was slightly better than Consensus expectations for a rise to 1.54M starts. The year-to-date [...]
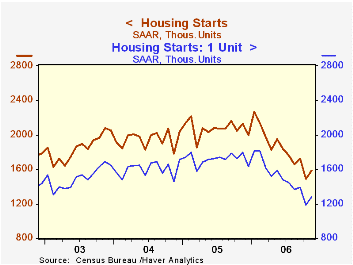
November housing starts recovered less than half of the previous month's little revised decline with a 6.7% increase. The gain to 1.588M was slightly better than Consensus expectations for a rise to 1.54M starts.
The year-to-date average for starts of 1.588M was 11.7% below the first eleven months of 2005.
Single-family starts in November rose 8.1% to 1.281M, recovering less than half of the October decline which was to the lowest level since July 2000. The year-to-date average level of single family starts was 12.6% below 2005.
Multi-family starts gained back just 1.3% of the 8.5% October drop and were down 4.5% during this year's first eleven months.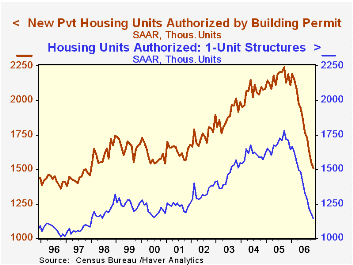
By region, single family housing starts in the South posted a 14.1% (-22.1% y/y) increase but that was only about half of the sharp October decline. Single family starts in the Northeast again were up (-13.6% y/y) but the gains during the last two months still have not recovered the precipitous 16.7% decline during September. Starts in the Midwest rose 1.5% (-37.6% y/y) and starts out West nudged up 1.4% (-38.5% y/y).
Building permits fell 3.0% after a little revised 5.2% decline during October. This tenth monthly decline this year was to the lowest level since 1997. Permits to start single family homes fell 3.1% (-33.3% y/y) for the second consecutive month to the lowest since 1997.
What Do Financial Asset Prices Say About the Housing Market? from the Board of Governors of the Federal Reserve System can be found here.
| Housing Starts (000s, AR) | November | October | Y/Y | 2005 | 2004 | 2003 |
|---|---|---|---|---|---|---|
| Total | 1,588 | 1,488 | -25.5% | 2,073 | 1,950 | 1,854 |
| Single-family | 1,281 | 1,185 | -28.6% | 1,719 | 1,604 | 1,505 |
| Multi-family | 303 | 303 | -8.6% | 354 | 345 | 349 |
| Building Permits | 1,506 | 1,553 | -31.3% | 2,159 | 2,058 | 1,888 |
by Tom Moeller December 19, 2006
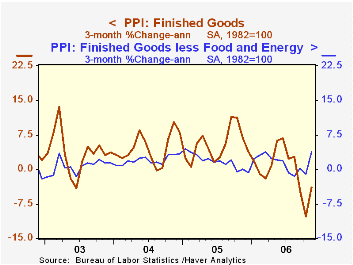
The producer price index for finished goods surged 2.0% last month and far surpassed Consensus expectations for a 0.6% rise. It was the largest one month increase since 1974 and reflected higher energy & nonenergy prices. The core PPI jumped a surprising 1.3% and easily beat Consensus expectations for a 0.2% uptick with the largest m/m increase since 1980.
Finished energy goods prices recovered all of the prior month's decline with a 6.1% (-1.8% y/y) increase. Gasoline prices jumped 17.9% (3.5% y/y) after three months of sharp decline and fuel oil prices surged 7.7% (6.1% y/y). Natural gas prices also recovered most of their October drop with a 5.9% (-14.1% y/y) increase.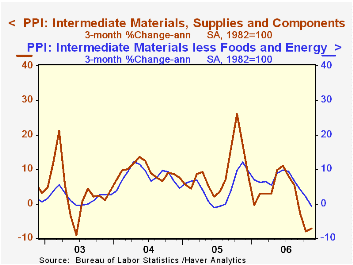
Finished consumer goods prices less food & energy jumped 1.1% (1.7% y/y) after the 0.8% October decline and the rise was led by a 2.2% (-0.7% y/y) increase in passenger cars. Furniture prices rose 0.2% (2.5% y/y) for the second month.
The 1.4% (2.2% y/y) surge in capital equipment prices followed a 0.9% October decline and reflected a 13.6% (0.7% y/y) recovery in light truck prices which had plunged 9.7% during the prior month.
Intermediate goods prices increased 0.7% but prices less food & energy fell 0.3% reflecting a huge 4.4% (+12.2% y/y) decline in steel mill products prices.
The crude materials PPI recovered all of the prior months decline with a 15.7% surge as natural gas prices nearly doubled m/m (-35.1% y/y). Plywood & timber prices surged 5.0% (7.5% y/y) and aluminum base scrap rose 2.7% (28.8% y/y).
| Producer Price Index | November | October | Y/Y | 2005 | 2004 | 2003 |
|---|---|---|---|---|---|---|
| Finished Goods | 2.0% | -1.6% | 0.9% | 4.9% | 3.6% | 3.2% |
| Core | 1.3% | -0.9% | 1.8% | 2.4% | 1.5% | 0.2% |
| Intermediate Goods | 0.7% | -1.1% | 2.6% | 8.0% | 6.6% | 4.7% |
| Core | -0.3% | 0.0% | 5.1% | 5.5% | 5.7% | 2.0% |
| Crude Goods | 15.7% | -10.5% | -8.5% | 14.6% | 17.5% | 25.1% |
| Core | 0.5% | -1.3% | 17.8% | 4.8% | 26.5% | 12.4% |
by Tom Moeller December 19, 2006
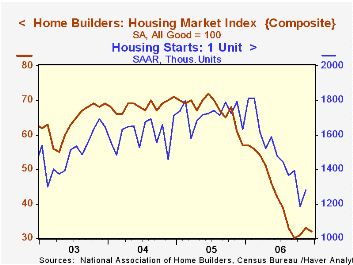
The Composite Housing Market Index from the National Association of Home Builders' (NAHB) slipped in December to 32 and gave back half of last month's improvement. The index, therefore, remained down 5.9% in the fourth quarter versus 3Q and off nearly one half from last year.
During the last twenty years there has been a 76% correlation between the y/y change in the Composite Index and the change in single family housing starts.
The decline was led by a falloff in the traffic of prospective home buyers which reversed all of the November gain (-42.5% y/y).
The sub-index for current sales also was unchanged m/m (-48.4% y/y) but the sub-index covering prospective sales in the next six months improved to its highest level since July (-26.2% y/y).
The housing market index for the Midwest rose sharply (-35.3% y/y) to the highest level since June but that was offset by deterioration in the West (-58.7% y/y).
The NAHB index is a diffusion index based on a survey of builders. Readings above 50 signal that more builders view conditions good than poor.
Visit the National Association of Home Builders.
| Nat'l Association of Home Builders | December | November | Dec. '05 | 2006 | 2005 | 2004 |
|---|---|---|---|---|---|---|
| Composite Housing Market Index | 32 | 33 | 57 | 42 | 67 | 68 |
by Tom Moeller December 19, 2006
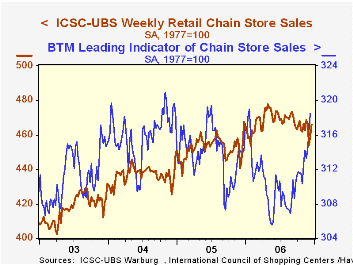
The ICSC-UBS retail chain-store sales index is constructed using the same-store sales (stores open for one year) reported by 78 stores of seven retailers: Dayton Hudson, Federated, Kmart, May, J.C. Penney, Sears and Wal-Mart.
The leading indicator of chain store sales from ICSC-UBS rose again by 0.7% for the fifth weekly gain in the last six.
| ICSC-UBS (SA, 1977=100) | 12/16/06 | 12/09/06 | Y/Y | 2005 | 2004 | 2003 |
|---|---|---|---|---|---|---|
| Total Weekly Chain Store Sales | 466.1 | 458.8 | 2.4% | 3.6% | 4.7% | 2.9% |
by Tom Moeller December 19, 2006
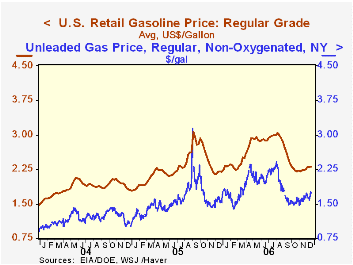
 The spot market (NY harbor) price for a gallon of regular gasoline has surged recently with the price yesterday at $1.74 per gallon versus an average $1.66 last week.
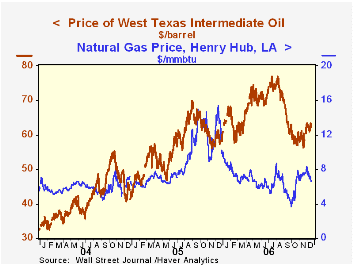
Oil prices also have been firm with the price yesterday for WTI crude at $62.22 (8.5% y/y).
The spot market (NY harbor) price for a gallon of regular gasoline has surged recently with the price yesterday at $1.74 per gallon versus an average $1.66 last week.
Oil prices also have been firm with the price yesterday for WTI crude at $62.22 (8.5% y/y).
The latest Short-Term Energy Outlook from the U.S. Energy Information Administration is available here.
| Weekly Energy Prices | 12/18/06 | 12/11/06 | Y/Y | 2005 | 2004 | 2003 |
|---|---|---|---|---|---|---|
| US Retail Gasoline Price, Regular | $2.32 | $2.29 | 4.9% | $2.27 | $1.85 | $1.56 |
by Louise Curley December 19, 2006
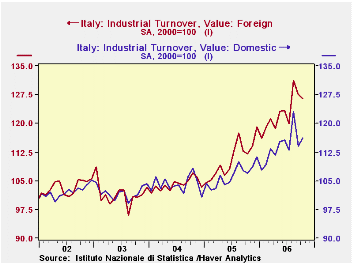
Italian industrial sales in October increased 1.19% from September and were up 9.88% from October 2005. While foreign industrial sales dipped almost 1%, domestic sales increased 2%. A somewhat more subdued picture is shown by orders. Total orders declined 0.17% in October, with foreign orders, down 0.63% and domestic orders up 0.09% Domestic and foreign orders were, however, well above year ago figures, with domestic orders up14.49% and foreign, 10.88%. Domestic and foreign sales are shown in the first chart and domestic and foreign orders in the second.
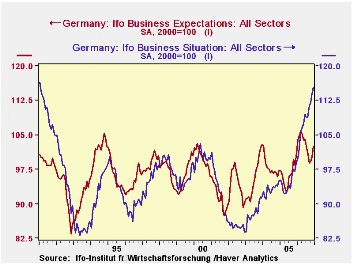
Earlier this month German institutional investors and analysts of the ZEW survey swung from being pessimistic to being optimistic about conditions over the next six months. The businessmen represented in the IFO survey had been more positive than the financial types for several previous months. This month they continue to be optimistic regarding the current conditions and expectations for the next six months. The overall index at 108.7 has regained the peak reached when the series began in January, 1991 as can be seen in the third chart which shows the entire history of the series. The history of the business men's appraisal of current conditions and their expectations for the next six months are show in the fourth chart where the current values are at or near all time highs.
| ITALY INDUSTRIAL ORDERS AND SALES (2000=100) | Oct 06 | Sep 06 | Oct 05 | M/M% | Y/Y% | 2005 | 2004 | 2003 |
|---|---|---|---|---|---|---|---|---|
| Industrial Sales | 119.0 | 117.6 | 108.3 | 1.19 | 9.88 | 107.5 | 104.1 | 101.8 |
| Domestic | 116.3 | 114.0 | 106.9 | 2.02 | 8.79 | 106.4 | 104.1 | 101.9 |
| Foreign | 126.4 | 127.5 | 112.0 | -0.86 | 12.86 | 110.7 | 104.0 | 101.4 |
| Industrial Orders | 117.1 | 117.3 | 103.4 | -0.17 | 13.25 | 102.8 | 99.0 | 95.3 |
| Domestic | 113.0 | 112.9 | 98.7 | 0.09 | 14.49 | 98.9 | 96.8 | 93.9 |
| Foreign | 126.4 | 127.2 | 114.0 | -0.63 | 10.88 | 111.6 | 103.7 | 98.7 |
| GERMANY IFO SURVEY (2000=100) | Dec 06 | Nov 06 | Dec 05 | M/M% | Y/Y% | 2006 | 2005 | 2004 |
| Overall | 108.7 | 106.8 | 99.5 | 1.78 | 9.25 | 105.5 | 95.5 | 95.4 |
| Current Conditions | 115.3 | 113.9 | 98.8 | 1.23 | 16.70 | 108.4 | 94.7 | 93.1 |
| Expectations 6 Months Ahead | 102.5 | 100.2 | 100.3 | 2.30 | 2.19 | 102.7 | 96.3 | 97.8 |

Tom Moeller
AuthorMore in Author Profile »Prior to joining Haver Analytics in 2000, Mr. Moeller worked as the Economist at Chancellor Capital Management from 1985 to 1999. There, he developed comprehensive economic forecasts and interpreted economic data for equity and fixed income portfolio managers. Also at Chancellor, Mr. Moeller worked as an equity analyst and was responsible for researching and rating companies in the economically sensitive automobile and housing industries for investment in Chancellor’s equity portfolio. Prior to joining Chancellor, Mr. Moeller was an Economist at Citibank from 1979 to 1984. He also analyzed pricing behavior in the metals industry for the Council on Wage and Price Stability in Washington, D.C. In 1999, Mr. Moeller received the award for most accurate forecast from the Forecasters' Club of New York. From 1990 to 1992 he was President of the New York Association for Business Economists. Mr. Moeller earned an M.B.A. in Finance from Fordham University, where he graduated in 1987. He holds a Bachelor of Arts in Economics from George Washington University.
More Economy in Brief


