 Global| Oct 17 2002
Housing Starts Much Stronger Than Expected
by:Tom Moeller
|in:Economy in Brief
Summary
Housing starts were stronger than expected last month rising 13.3% m/m to the highest level since 1986. Starts in August were revised slightly higher due to raised multi-family starts. Single family starts rose 18.2% from the previous [...]
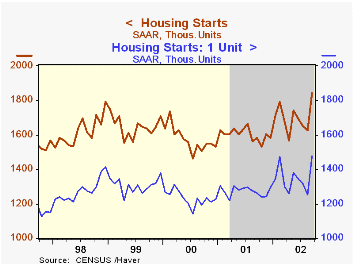
Housing starts were stronger than expected last month rising 13.3% m/m to the highest level since 1986. Starts in August were revised slightly higher due to raised multi-family starts.
Single family starts rose 18.2% from the previous month to a record high.
Multi-family starts fell slightly m/m and have moved sideways since 1997.
Building permits rose 3.7% m/m to the highest level since February led by strong permits for single family homes. Permits for multi-family unit structures also rose.
| Housing Starts (000s, AR) | Sept | Aug | Y/Y | 2001 | 2000 | 1999 |
|---|---|---|---|---|---|---|
| Total | 1,843 | 1,627 | 16.5% | 1,603 | 1,573 | 1,647 |
| Single Family | 1,477 | 1,250 | 16.9% | 1,273 | 1,232 | 1,306 |
| Multi Family | 366 | 377 | 14.7% | 330 | 341 | 341 |
by Tom Moeller October 17, 2002
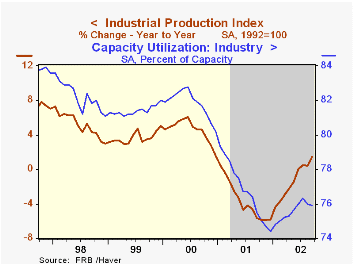
Industrial production fell slightly in September versus Consensus expectations for a 0.1% rise. August figures were little revised. Production was up 3.7% (AR) year to date.
Output in the manufacturing sector fell 0.2% (3.3% AR, YTD) for the second consecutive month.
Lower motor vehicle and parts output (12.6% AR, YTD) led the factory sector decline, off for the second consecutive month. Output of furniture & fixtures fell for the sixth month this year.
Output of business equipment fell a sharp 1.7% (-2.5% AR, YTD) led by lower output of transit and other industrial equipment. Output of information processing equipment rose for only the third time this year
Capacity utilization fell slightly to the lowest level since May. Capacity again rose 0.1%(1.0% AR, YTD) as it has since early last year.
| Production & Capacity | Sept | Aug | Y/Y | 2001 | 2000 | 1999 |
|---|---|---|---|---|---|---|
| Industrial Production | -0.1% | -0.3% | 1.4% | -3.7% | 4.5% | 3.7% |
| Capacity Utilization | 75.9% | 76.0% | 75.5%(9/01) | 76.8% | 81.8% | 81.4% |
by Tom Moeller October 17, 2002
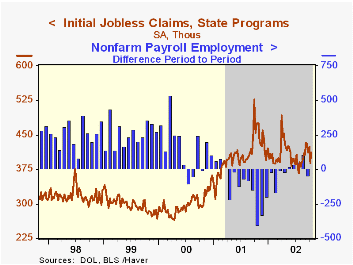
Initial claims for unemployment insurance rose as expected in the latest week. Claims in the prior week were revised up slightly.
The latest claims figure was for the survey period for October nonfarm payrolls and claims were down versus the September survey period.
The four-week moving average fell to 408,750, the lowest figure since late-August.
Continuing claims for unemployment insurance jumped 3.9% in the latest available week but the prior week's levelwas revised down. The latest figure was the highest since late May.
The weekly insured rate of unemployment rose to 2.9% from 2.8% the previous week.
| Unemployment Insurance (000s) | 10/12/02 | 10/5/02 | Y/Y | 2001 | 2000 | 1999 |
|---|---|---|---|---|---|---|
| Initial Claims | 411.0 | 389.0 | -12.7% | 405.8 | 299.8 | 297.7 |
| Continuing Claims | -- | 3,755 | 8.1% | 3,021 | 2,114 | 2,186 |
by Tom Moeller October 17, 2002
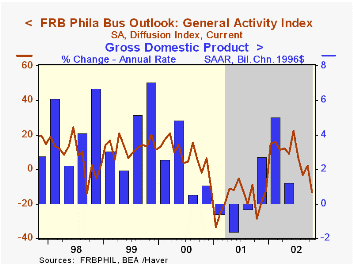
The Philadelphia Fed’s index of general business conditions for October was much weaker than expected. The Business Activity Index fell to -13.1, the lowest level since last November but only the second negative reading this year. A slightly positive reading had been expected.
Amongst the components, all turned negative versus September.
The business conditions index reflects a separate survey question, not the components.
The prices paid index fell modestly, but remained quite positive as it has since March.
During the last ten years there has been a 46% correlation between the level of the General Activity Index and the quarterly change in real GDP. Over the last twenty years that correlation has been 67%.
For a discussion of the Philadelphia Fed's Business Outlook Survey click here.
| Philadelphia Fed Business Outlook | Oct | Sept | Y/Y | 2001 | 2000 | 1999 |
|---|---|---|---|---|---|---|
| General Activity Index | -13.1 | 2.3 | -18.5 | -17.3 | 8.2 | 13.3 |
| Prices Paid Index | 14.3 | 19.6 | -21.4 | -1.0 | 27.1 | 10.0 |

Tom Moeller
AuthorMore in Author Profile »Prior to joining Haver Analytics in 2000, Mr. Moeller worked as the Economist at Chancellor Capital Management from 1985 to 1999. There, he developed comprehensive economic forecasts and interpreted economic data for equity and fixed income portfolio managers. Also at Chancellor, Mr. Moeller worked as an equity analyst and was responsible for researching and rating companies in the economically sensitive automobile and housing industries for investment in Chancellor’s equity portfolio. Prior to joining Chancellor, Mr. Moeller was an Economist at Citibank from 1979 to 1984. He also analyzed pricing behavior in the metals industry for the Council on Wage and Price Stability in Washington, D.C. In 1999, Mr. Moeller received the award for most accurate forecast from the Forecasters' Club of New York. From 1990 to 1992 he was President of the New York Association for Business Economists. Mr. Moeller earned an M.B.A. in Finance from Fordham University, where he graduated in 1987. He holds a Bachelor of Arts in Economics from George Washington University.
More Economy in Brief


