 Global| Sep 19 2002
Housing Starts Fell Again
by:Tom Moeller
|in:Economy in Brief
Summary
Housing starts were weaker than expected last month. Total starts fell 2.2% from July which was revised slightly lower due to lowered single-family starts. It was the third consecutive monthly decline in starts. Housing starts were [...]
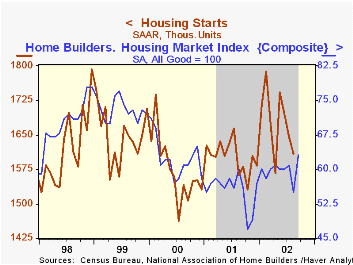
Housing starts were weaker than expected last month. Total starts fell 2.2% from July which was revised slightly lower due to lowered single-family starts. It was the third consecutive monthly decline in starts.
Housing starts were down 10.0% versus the recent peak in February.
Single family starts fell 4.4% from the previous month and fell during five of the last six months. Single-family starts were down 14.% from the February peak.
Multi-family starts rose after two months of decline. Versus a March peak, multi-family starts were down 5.3%.
Building permits fell 2.5%, down for the first month since March. Permits for single family homes rose for the fourth month in five. Permits for 5-or-more-unit structures slumped 18.5% m/m.
| Housing Starts (000s, AR) | Aug | July | Y/Y | 2001 | 2000 | 1999 |
|---|---|---|---|---|---|---|
| Total | 1,609 | 1,645 | 3.0% | 1,603 | 1,573 | 1,647 |
| Single Family | 1,252 | 1,309 | -1.7% | 1,273 | 1,232 | 1,306 |
| Multi Family | 357 | 336 | 24.0% | 330 | 341 | 341 |
by Tom Moeller September 19, 2002
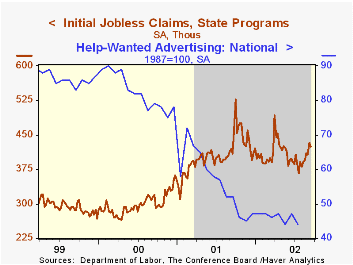
Initial claims for unemployment insurance were higher than expected in the latest week, though they declined slightly from the prior week which was revised higher.Claims fell 9,000 versus the prior week but they have risen 15.8% versus the weekly low of this past July.
The four-week moving average rose to 418,500, up 10.0% from the recent low.
Continuing claims for unemployment insurance rose 2.0% but the prior week's level was revised down. Continuing claims have risen 4.0% since the weekly low of this past July.
The weekly insured rate of unemployment was stable at 2.8% for the fourth consecutive week.
| Unemployment Insurance (000s) | 9/14/02 | 9/07/02 | Y/Y | 2001 | 2000 | 1999 |
|---|---|---|---|---|---|---|
| Initial Claims | 424.0 | 433.0 | 3.7% | 405.8 | 299.8 | 297.7 |
| Continuing Claims | -- | 3,615 | 11.9% | 3,021 | 2,114 | 2,186 |
by Tom Moeller September 19, 2002

The Philadelphia Fed’s index of general business conditions for September improved about as expected, but only slightly.
New orders and shipments turned positive after the one month drops to negative in August, but unfilled orders remained negative for the third straight month. Inventories continued to run off after a one month turn to positive in August.
The business conditions index reflects a separate survey question, not the components.
The prices paid index fell modestly, but remained quite positive as it has since March.
| Philadelphia Fed Business Outlook | Sept | Aug | Y/Y | 2001 | 2000 | 1999 |
|---|---|---|---|---|---|---|
| General Activity Index | 2.3 | -3.1 | -8.8 | -17.3 | 8.2 | 13.3 |
| Prices Paid Index | 19.6 | 23.9 | -13.3 | -1.0 | 27.1 | 10.0 |

Tom Moeller
AuthorMore in Author Profile »Prior to joining Haver Analytics in 2000, Mr. Moeller worked as the Economist at Chancellor Capital Management from 1985 to 1999. There, he developed comprehensive economic forecasts and interpreted economic data for equity and fixed income portfolio managers. Also at Chancellor, Mr. Moeller worked as an equity analyst and was responsible for researching and rating companies in the economically sensitive automobile and housing industries for investment in Chancellor’s equity portfolio. Prior to joining Chancellor, Mr. Moeller was an Economist at Citibank from 1979 to 1984. He also analyzed pricing behavior in the metals industry for the Council on Wage and Price Stability in Washington, D.C. In 1999, Mr. Moeller received the award for most accurate forecast from the Forecasters' Club of New York. From 1990 to 1992 he was President of the New York Association for Business Economists. Mr. Moeller earned an M.B.A. in Finance from Fordham University, where he graduated in 1987. He holds a Bachelor of Arts in Economics from George Washington University.
More Economy in Brief


