 Global| Feb 16 2005
Housing Starts At A New High in January
by:Tom Moeller
|in:Economy in Brief
Summary
Housing starts unexpectedly rose 4.7% in January to a record high of 2.159M following an upwardly revised 14.4% jump in December.Consensus expectations had been for a decline to 1.93M starts. Single-family starts rose a moderate 2.7% [...]
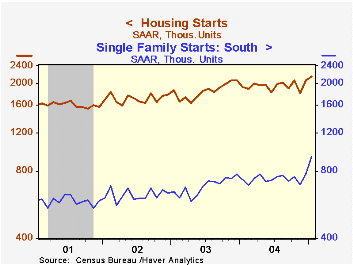
Housing starts unexpectedly rose 4.7% in January to a record high of 2.159M following an upwardly revised 14.4% jump in December.Consensus expectations had been for a decline to 1.93M starts.
Single-family starts rose a moderate 2.7% m/m to a record high of 1.760M. The increase, however, was limited to a 20.0% gain in starts in the South. In other regions of the country single family starts fell.
Multi family starts jumped 14.1% m/m but the gain was just about back to the October level.
Building permits rose 1.7% in January, again mostly reflecting strength in single family permits in the South.
Today's testimony by Federal Reserve Board Chairman Alan Greenspan is available here.
Wicksell's Natural Rate from the Federal Reserve Bank of St. Louis can be found here.
| Housing Starts (000s, AR) | Jan | Dec | Y/Y | 2004 | 2003 | 2002 |
|---|---|---|---|---|---|---|
| Total | 2,159 | 2,063 | 11.6% | 1,952 | 1,853 | 1,710 |
| Single-family | 1,760 | 1,713 | 12.5% | 1,605 | 1,505 | 1,363 |
| Multi-family | 399 | 350 | 8.1% | 348 | 348 | 347 |
| Building Permits | 2,105 | 2,069 | 6.8% | 2,035 | 1,889 | 1,749 |
by Tom Moeller February 16, 2005
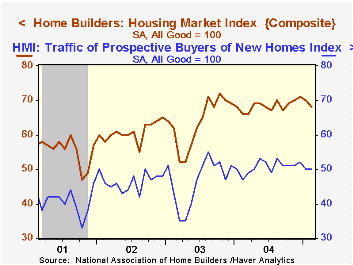
The National Association of Home Builders' (NAHB) Composite Housing Market Index fell again in February to 68 versus 70 in January.
Only the current sales of new single family homes component fell. The index components of prospective sales and the traffic of prospective buyers were stable.
During the last twenty years, annual changes in the composite index had an 83% correlation with the change in new home sales. There's been an 86% correlation with the change in single family housing starts.
The NAHB index is a diffusion index based on a survey of builders. Readings above 50 signal that more builders view conditions as good than poor.
Visit the National Association of Home Builders using this link.
| Nat'l Association of Home Builders | Feb | Jan | Feb '04 | 2004 | 2003 | 2002 |
|---|---|---|---|---|---|---|
| Composite Housing Market Index | 68 | 70 | 66 | 68 | 64 | 61 |
by Tom Moeller February 16, 2005
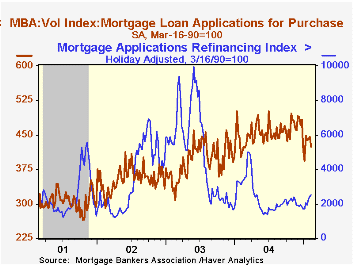
Mortgage applications dipped modestly last week following two weeks of gain according to the Mortgage Bankers Association (MBA) Survey. The 0.5% w/w decline followed gains of 4.2% and 7.3% during the prior two weeks.
The decline was due to a 4.8% drop in purchase applications. During the last ten years there has been a 59% correlation between the y/y change in purchase applications and the change in new plus existing home sales.
Applications to refinance rose another 4.1% following two weeks of gain but versus last year still are down 23.3%.
The effective interest rate on a conventional 30-year mortgage ticked higher to 5.75% but remained below the 5.89% averaged last month. The effective rate on a 15-year mortgage also rose to 5.41% last week.
The Mortgage Bankers Association surveys between 20 to 35 of the top lenders in the U.S. housing industry to derive its refinance, purchase and market indexes. The weekly survey accounts for more than 40% of all applications processed each week by mortgage lenders. Visit the Mortgage Bankers Association site here.
| MBA Mortgage Applications (3/16/90=100) | 02/11/05 | 02/04/05 | Y/Y | 2004 | 2003 | 2002 |
|---|---|---|---|---|---|---|
| Total Market Index | 732.3 | 735.9 | -12.5% | 735.1 | 1,067.9 | 799.7 |
| Purchase | 423.3 | 444.6 | 2.3% | 454.5 | 395.1 | 354.7 |
| Refinancing | 2,530.1 | 2,430.7 | -23.3% | 2,366.8 | 4,981.8 | 3,388.0 |
by Tom Moeller February 16, 2005
Industrial production was unchanged last month versus Consensus expectations for a 0.3% increase. The shortfall was entirely due to a 3.1% decline in utility output as well as a 0.3% drop in mining output.
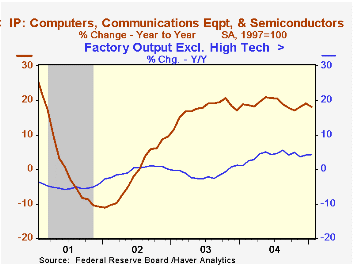
The factory sector again performed well and output rose 0.5% (5.3% y/y) following a downwardly revised 0.4% gain in December.
High tech sector output increased 1.5% (18.1% y/y) as output of communications equipment rose 3.0% (13.8% y/y). Semiconductor & related equipment output rose 0.9% (26.5% y/y) and computer & peripheral output also gained 0.9% (6.0% y/y).
Factory output excluding high tech rose 0.4% in December (4.4% y/y). A 1.2% decline in clothing output (-5.0% y/y) was offset by a 1.6% rise (9.5% y/y) in machinery output. Nondurables output also rose as did output of metals. Production of appliances, furniture & carpeting fell 1.1% (-0.4% y/y) as furniture output fell 0.5% (+1.3% y/y).
Motor vehicle output fell 2.0% (+0.2% y/y) in January. Excluding motor vehicles, factory output rose 0.7% (5.7% y/y). Excluding both high tech and motor vehicles factory output rose 0.6% (4.8% y/y).
Total capacity utilization fell slightly to 79.0%. Capacity grew 1.2% y/y.
| Production & Capacity | Jan | Dec | Y/Y | 2004 | 2003 | 2002 |
|---|---|---|---|---|---|---|
| Industrial Production | 0.0% | 0.7% | 4.0% | 4.1% | -0.0% | -0.3% |
| Capacity Utilization | 79.0% | 79.1% | 76.9% (01/04) | 78.0% | 75.5% | 75.3% |

Tom Moeller
AuthorMore in Author Profile »Prior to joining Haver Analytics in 2000, Mr. Moeller worked as the Economist at Chancellor Capital Management from 1985 to 1999. There, he developed comprehensive economic forecasts and interpreted economic data for equity and fixed income portfolio managers. Also at Chancellor, Mr. Moeller worked as an equity analyst and was responsible for researching and rating companies in the economically sensitive automobile and housing industries for investment in Chancellor’s equity portfolio. Prior to joining Chancellor, Mr. Moeller was an Economist at Citibank from 1979 to 1984. He also analyzed pricing behavior in the metals industry for the Council on Wage and Price Stability in Washington, D.C. In 1999, Mr. Moeller received the award for most accurate forecast from the Forecasters' Club of New York. From 1990 to 1992 he was President of the New York Association for Business Economists. Mr. Moeller earned an M.B.A. in Finance from Fordham University, where he graduated in 1987. He holds a Bachelor of Arts in Economics from George Washington University.
More Economy in Brief


