 Global| May 23 2005
Home Price Inflation: Location, Location, Location
by:Tom Moeller
|in:Economy in Brief
Summary
The old adage of real estate about location has never been more true than during the last several years. During the last three years the Nat'l Association of Realtors reports the median sales price of an existing single family home [...]
The old adage of real estate about location has never been more true than during the last several years. During the last three years the Nat'l Association of Realtors reports the median sales price of an existing single family home rose at an 8.3% rate.
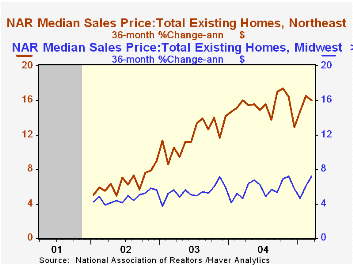
In the West and in the Northeast home price appreciation hit double digits and in certain local markets has been astronomical. During the last five years, the 10.2% appreciation in home prices in the Western region of the U.S. is not even half the 21.6% rate of gain in Sacramento, CA. A 13.6% rate of increase in the Northeast was paced by a 14.0% rate of gain in Monmouth & Ocean Counties, NJ.
The rate of gain in these markets has been at least double that in the Midwest and in the South. A 6.1% rate of increase throughout the Midwest was restrained by just a 2.0% rate of increase in Detroit, MI and a 2.2% gain in Cleveland, OH. In the South, a 7.3% rate increase owes much to a 7.7% rise in Charleston, SC because Atlanta, GA lagged with only a 4.9% rate of home price appreciation over the last five years.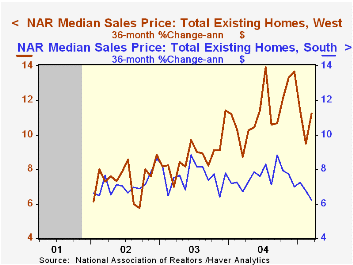
The levels of home prices certainly differ greatly by region with the median price for all of the US at $195,000 in March. In the West, homes were the priciest with the median at $289,000 and Sacramento homes cost $352,900. The Northeast lagged not far behind at $242,000 with homes in Monmouth & Ocean Counties fetching a higher median of $358,500.
Economic growth explains some of these differing patterns. Through 2002, real gross state product in California averaged 5.3% for five years while in New Jersey growth averaged 4.4%. Actually, Michigan lagged not far behind with a 4.1% average and neither did Georgia with 4.9%. But growth in Ohio of 2.9% was off the national pace of 3.0% and Mississippi at 2.7% lagged as well.
The latest report from the Office of Federal Housing Enterprise Oversight (OFHEO) is available here.
Fed Chairman Greenspan's speech to the Economic Club of New York on Friday is available here.
| Nat'l Assn. of Realtors - Median Home Sales Price | Last 12 Months | Last Five Years | 2004 | 2003 | 2002 |
|---|---|---|---|---|---|
| United States | 11.4% | 8.1% | 9.2% | 8.1% | 8.4% |
| West | 18.9 | 10.2 | 13.3 | 9.1 | 11.8 |
| Northeast | 14.7 | 13.6 | 16.5 | 16.2 | 13.4 |
| Midwest | 11.2 | 6.1 | 6.0 | 5.0 | 6.3 |
| South | 7.0 | 7.3 | 7.9 | 7.0 | 7.8 |
| OFHEO Repeat Home Sales Price Index | 11.2 | 8.4 | 10.8 | 7.0 | 7.0 |
by Louise Curley May 23, 2005
South Korea and Taiwan have recently reported first quarter Gross Domestic Product numbers.
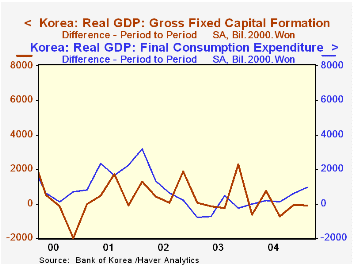
GDP in South Koreas increased 0.35% in the first quarter or at an annual rate of 1.41%. This was well below the annual growth rates of the past three years, of 4.7%, 3.2% and 7.0 respectively for 2004, 2003 and 2002. Much of the slow growth was due to a massive liquidation of inventories in contrast to inventory accumulation in much of 2004. In addition, fixed investment was down by 110.4 billion won. On the plus side were consumption which increased by 961.7 billion won and net exports of goods and services which increased by 4,845.5 billion won. The year to year changes in Fixed Investment and in Consumption for South Korea are shown in the first chart.
The quarter to quarter increase in GDP in Taiwan was 0.87% or 3.53% at an annual rate which was better than that of South Korea, but below Taiwan's growth of 5.71% in 2004. As in the case of South Korea, a major negative was a big inventory liquidation. In contrast to South Korea, fixed investment in Taiwan was a major positive. Increases in consumption and the net export of goods and services helped to offset the impact of the inventory liquidation. The course of the year to year changes consumption and fixed investment expenditures in Taiwan are shown in the second chart.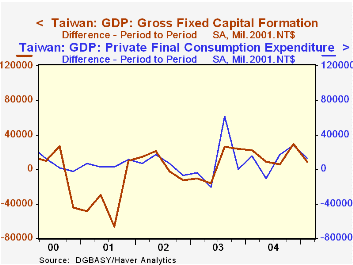
| Emerging Markets | Q1 20 05 | Q4 20 04 | Q3 20 04 | Q2 20 04 | Q1 2004 | 2004 | 2003 | 2002 |
|---|---|---|---|---|---|---|---|---|
| GDP (Period to Period) | ||||||||
| Taiwan | 0.87 | -0.48 | 2.31 | -0.09 | 1.07 | 5.71 | 3.33 | 3.94 |
| South Korea | 0.35 | 0.94 | 0.81 | 0.60 | 0.65 | 4.66 | 3.15 | 6.95 |
| GDP (Year over Year) | ||||||||
| Taiwan | 2.61 | 2.91 | 5.55 | 7.92 | 6.74 | |||
| South Korea | 2.72 | 3.03 | 4.91 | 5.28 | 5.17 | |||
| Change Q4 04 to Q1 05 | Taiwan (Mil 2001 NT$) | South Korea (Bil 2000 Won) | ||||||
| Consumption | 10776 | 961.7 | ||||||
| Fixed Investment | 9095 | -110.4 | ||||||
| Inventories | -40659 | -4742.6 | ||||||
| Net Export of Gds & Serv. | 44343 | 4845.5 | ||||||
| Stat. Discrepancy | -339.6 | |||||||
| Total | 23555 | 614.6 |

Tom Moeller
AuthorMore in Author Profile »Prior to joining Haver Analytics in 2000, Mr. Moeller worked as the Economist at Chancellor Capital Management from 1985 to 1999. There, he developed comprehensive economic forecasts and interpreted economic data for equity and fixed income portfolio managers. Also at Chancellor, Mr. Moeller worked as an equity analyst and was responsible for researching and rating companies in the economically sensitive automobile and housing industries for investment in Chancellor’s equity portfolio. Prior to joining Chancellor, Mr. Moeller was an Economist at Citibank from 1979 to 1984. He also analyzed pricing behavior in the metals industry for the Council on Wage and Price Stability in Washington, D.C. In 1999, Mr. Moeller received the award for most accurate forecast from the Forecasters' Club of New York. From 1990 to 1992 he was President of the New York Association for Business Economists. Mr. Moeller earned an M.B.A. in Finance from Fordham University, where he graduated in 1987. He holds a Bachelor of Arts in Economics from George Washington University.
More Economy in Brief


