 Global| Jul 07 2006
Growth in U.S. Payrolls Moderate, Wages Jump
by:Tom Moeller
|in:Economy in Brief
Summary
A 121,000 gain in June nonfarm payrolls fell short of Consensus expectations for a 155,000 increase. Disappointment should be mitigated, however, by details within the jobs report that indicate continuing, moderate expansion of the [...]
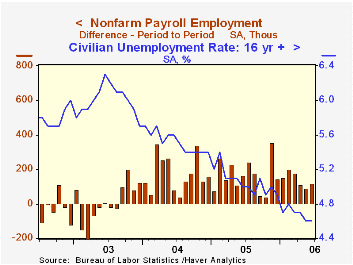
A 121,000 gain in June nonfarm payrolls fell short of Consensus expectations for a 155,000 increase. Disappointment should be mitigated, however, by details within the jobs report that indicate continuing, moderate expansion of the U.S. labor market.
Revisions raised the gain in May payrolls to 92,000 and a 15,000 worker June gain factory sector payrolls pulled the y/y growth positive (barely) for the first time since 2000.
From the household survey, the unemployment rate remained low at an expected 4.6% due to a whopping 387,000 (1.8% y/y) gain in employment while the labor force rose 330,000 (1.4% y/y). The labor force participation rate rose to 66.2%, its highest level in three years, though the rate for males over 20 dropped to a low 75.7%. That decline was offset by a rise in the participation rate for females over 20 to 60.6%.
Lengthening of the workweek to an average 33.9 hours raised aggregate weekly hours worked in private industry by 0.4%. That was enough to raise the 2Q level 2.3% (AR) versus a 1Q increase of 3.0%. Both figures are improved versus 2.2% average growth during the second half of last year.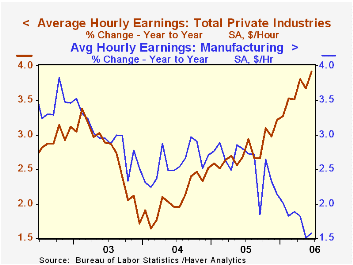
Average hourly earnings jumped 0.5% versus an expected 0.3% increase and an unrevised 0.1% May up tick. The 3.9% y/y gain is the strongest since 2001. Private service-producing wages rose 0.4% (4.3% y/y) while factory sector earnings rose 0.2% (1.6% y/y).
The breadth of one month gain in private payrolls fell to 55.4% in June versus a high 61% in January and 61.7% last November. For the factory sector, a 54.8% one month breadth of gain was improved from 42.7% during all of last year.
Factory sector payrolls advanced for the second month in the last three due to growth in the electrical equipment & appliance (2.6% y/y) industry as well as in computer & electronic products (0.7% y/y), machinery (1.8% y/y) and chemical (1.3% y/y) sectors. Growth in most other nondurable goods industries continued negative.
Private service-producing jobs rose a modest 75,000 (1.5% y/y) last month, about the same as in May. The per month average gain of 69,000 during 2Q was the weakest since 3Q 2004. Retail trade sector jobs fell 6,600 (-0.2% y/y), the third decline in the last four months. Financial sector jobs rose 3,000 (2.5% y/y) and professional & business services employment rose 25,000 (2.6% y/y). Temporary help services jobs fell by 7,900 (+3.2% y/y). It was the fourth m/m decline this year though May was revised to show an increase. Jobs in education & health services rose 26,000 (2.2% y/y).
Construction employment reversed all of an upwardly revised 4,000 May increase (3.1% y/y).
Is the United States Bankrupt? from the Federal Reserve Bank of St. Louis is available here.
| Employment | June | May | Y/Y | 2005 | 2004 | 2003 |
|---|---|---|---|---|---|---|
| Payroll Employment | 121,000 | 92,000 | 1.4% | 1.5% | 1.1% | -0.3% |
| Manufacturing | 15,000 | -8,000 | 0.1% | -0.6% | -1.3% | -4.9% |
| Average Weekly Hours | 33.9 | 33.8 | 33.7 (June '05) | 33.8 | 33.7 | 33.7 |
| Average Hourly Earnings | 0.5% | 0.1% | 3.9% | 2.8% | 2.1% | 2.7% |
| Unemployment Rate | 4.6% | 4.6% | 5.0% (June '05) | 5.1% | 5.5% | 6.0% |
by Carol Stone July 7, 2006
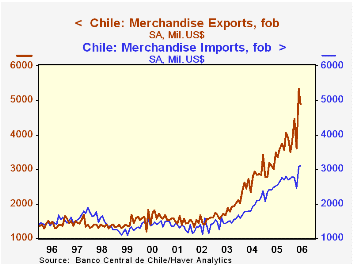
The recent construction boom in the US and accelerated economic development in China, India and other countries have increased demand for and prices of copper, which is by far the main export of Chile. In trade data reported today and within the last 10 days, it is evident that this has brought much revenue into the Chilean economy. 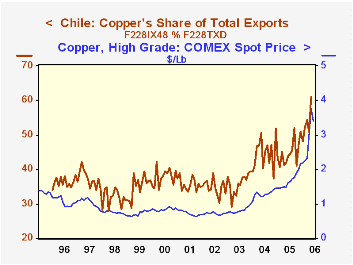
The trade surplus for June on an fob/fob basis ("freight-on-board": that is, just the value of the merchandise) was $1,784.3 million, nearly double the $963.3 million of June 2005. The central Bank of Chile reports individual import items on a "cif" basis, that is, including "cost, insurance, and freight", so imports are always higher on this basis; the latest actual cif import figure for May was $3,125.3 million compared with an fob number of $3,089.7 million. We estimated June's cif from the recent behavior of the differential ratio that accounts for the insurance and freight components. The resulting fob/cif trade surplus is $1,543.2 million, which compares with $834.3 million a year ago, again, nearly double. 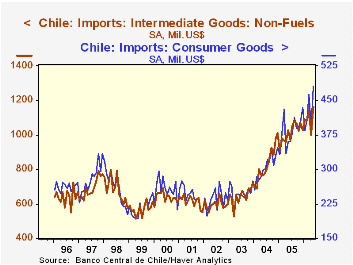
Both exports and imports have grown greatly over the past year. Exports are 40.4% larger and imports 26.4%. In the table below, we see that copper is a substantial portion of Chile's total exports. From June 2005 through May 2006, the value of copper exports had more than doubled, and copper increased to about 56% of exports. This is obviously related to world prices of copper, which we show in the accompanying chart, using the COMEX spot price. For the month of May alone, when prices spiked above $3.76 a pound, copper was 60.8% of Chile's exports. Some bit of price decline occurred in June, and while the details are not available, Chile's total exports fell back by about $430 million.
Among imports, consumer goods are expanding with a strong and consistent uptrend. Intermediate goods other than petroleum are also. Capital goods were gaining sharply, but have fallen back since the beginning of this year. Overall, even as Chile is enjoying its growing trade surplus, it also appears to be spending some of the added revenue on the people and products of the country.
| Chile: SA, Millions of US$ | June 2006 | May 2006 | Apr 2006 | June 2005 | 2005 | 2004 | 2003 |
|---|---|---|---|---|---|---|---|
| Trade Balance, fob/cif | 1543.2E* | 2199.6 | 822.5 | 834.3 | 8163.0 | 7490.7 | 2296.9 |
| Exports, fob | 4894.7 | 5324.9 | 3617.5 | 3485.4 | 40583.8 | 32226.6 | 21660.7 |
| Copper | -- | 3237.9 | 1844.4 | 1529.2 | 18307.7 | 14887.0 | 7815.5 |
| Imports, cif | 3351.5E* | 3125.3 | 2795.0 | 2651.1 | 32420.8 | 24735.9 | 19363.8 |
| Petroleum | -- | 578.9 | 298.9 | 332.6 | 3779.3 | 2874.6 | 2125.6 |
| Copper Price** | 3.3963 | 3.7609 | 2.9641 | 1.6219 | 1.6825 | 1.2898 | 0.8105 |
Tom Moeller
AuthorMore in Author Profile »Prior to joining Haver Analytics in 2000, Mr. Moeller worked as the Economist at Chancellor Capital Management from 1985 to 1999. There, he developed comprehensive economic forecasts and interpreted economic data for equity and fixed income portfolio managers. Also at Chancellor, Mr. Moeller worked as an equity analyst and was responsible for researching and rating companies in the economically sensitive automobile and housing industries for investment in Chancellor’s equity portfolio. Prior to joining Chancellor, Mr. Moeller was an Economist at Citibank from 1979 to 1984. He also analyzed pricing behavior in the metals industry for the Council on Wage and Price Stability in Washington, D.C. In 1999, Mr. Moeller received the award for most accurate forecast from the Forecasters' Club of New York. From 1990 to 1992 he was President of the New York Association for Business Economists. Mr. Moeller earned an M.B.A. in Finance from Fordham University, where he graduated in 1987. He holds a Bachelor of Arts in Economics from George Washington University.


