 Global| Sep 14 2012
Goods Price Trends Turn Lower Faster - Who Cares as Fed Shifts to Overdrive
Summary
Inflation is remaining moderate. But the weakness in core prices this month may not be as widespread as a 0.1% core rise would have you believe. It is always dodgy to try to judge inflation trends when energy prices are gyrating. The [...]
 Inflation is remaining moderate. But the weakness in core prices this month may not be as widespread as a 0.1% core rise would have you believe. It is always dodgy to try to judge inflation trends when energy prices are gyrating. The 0.6% surge the headline CPI is huge and with energy prices going up they certainly suck some of the life out of other prices as consumers try to make good with fewer discretionary dollars elsewhere. Also the rise in energy prices usually catches the consumer by surprise. This month’s energy price pop was rise at a 170% annual rate. Ouch!
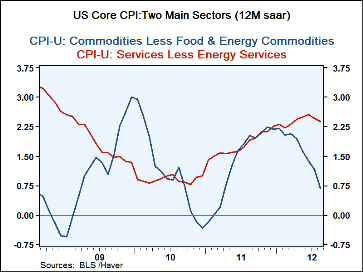
In the services sector excluding energy inflation has been a bit steadier at a pace of around 2%. In the goods sector ex food & energy continues to have a roller'coaster ride. Currently it is in a down phase with commodities excluding food & energy prices down to 0.2% pace, that’s an annualize rate of change over three-months of nearly zero.
Goods prices (or commodities prices) reflect the effects of international competition and the value of the dollar fairly quickly. The service sector is more buffered and is affected by goods sector developments in a more roundabout way. Most of this economy’s jobs are in the service sector so there is not much impact on wages in services from developments in the goods sector. Services seem to reflect some strengthening in demand. There are still a lot of unemployed in the economy but we see prices in the service sector on a very steady pace with only a hint of a slowdown.
The Fed and inflation As the Fed shifts its gaze to the unemployment problem we can’t help but notice how little wiggle room the Fed has in terms of its CPI performance. The Fed now claims to target the headline inflation which surged at a 7.5% annual rate in August is up at a 2.8% pace in the last three months and is up by 1.7% Yr/Yr compared to a ‘desired value’ of 2%. Yet the Fed takes the day before this report is released to say it is doing to emphasize getting unemployment down- a clear message if ever there was one. Surely the unemployment rate is farther from equilibrium than the CPI or PCE at 8.1% on the Fed’s view that it should be in the long run at 5.6%. So the Fed has 0.3 pct points to ‘play with’ in the CPI while it is 2.5 pct points behind the eight-ball on its unemployment mandate. There may be a few more basis points of wiggle in the PCE, but we do not have that yet for August.
In his press Conference Mr Bernanke dodged the questions on whether the Fed would now tolerate more inflation. But he did say that the Fed balances both its mandates. Currently, on a net basis, the Fed is missing both its mandates by about 29%. It is 15% below its inflation target and 45% above its unemployment target: that is a skewed miss. If the Fed were to shoot for an even handed miss of about 29% on each target it would have to get unemployment to 7.2% and let inflation rise to 2.6%.
Of course these are merely illustrative calculations meant to get you thinking and they can be performed several different ways. But the point is that the Fed seems upset that it has such a big miss on unemployment while it is doing well on its traditional mandate, inflation. It seems desperate to do something about it. The Chairman has been very noncommittal about what it means and has evaded direct questions. But if the Fed is going to try to come closer to hitting one of its targets, the implication for its other target is inescapable, except on the most fortuitous occasions. So if you do not want to ratchet up inflation fears today it must be because you are feeling lucky. Good for you.
| Consumer Prices: 2012 August | ||||||||
|---|---|---|---|---|---|---|---|---|
| Summary | Year-to-Date | One Mo | Mo/Mo | |||||
| yr/yr | 6-Mo a.r. | 6-Mo a.r. | 2011 | 2010 | Diffusion | Aug-12 | ||
| CPI | 1.7% | 1.5% | 2.8% | -- | 2.0% | 4.0% | 61.1% | NOT |
| Core CPI | 1.9% | 2.1% | 1.4% | -- | 2.0% | 2.5% | 47.1% | Annualized |
| Commodity | Mo.ar | Annualized Inflation Rate for Last | ||||||
| Exp Category | Aug-12 | % Wgt | 3-Mos | 6-Mos | Year | Month | ||
| All Items | 7.5% | 100 | 2.8% | 1.5% | 1.7% | 0.6% | ||
| By Industry Group | ||||||||
| Nondurables | 22.2% | 31.26 | 5.8% | 0.8% | 1.8% | 1.7% | ||
| Durables | -0.3% | 10.57 | -0.6% | 0.5% | -0.5% | 0.0% | ||
| Services | 2.1% | 58.17 | 1.6% | 2.0% | 2.0% | 0.2% | ||
| By Economic Group | ||||||||
| Ex Food & Energy | 0.6% | 77.10 | 1.4% | 2.1% | 1.9% | 0.1% | ||
| Median Increase | 1.6% | 100.00 | 1.3% | 1.4% | 1.8% | 0.1% | ||
| Excl Energy | 0.9% | 92.32 | 1.5% | 2.0% | 1.9% | 0.1% | ||
| Comdty ex Food&Eng | -2.3% | 22.77% | 0.2% | 29% | 1.3% | 0.7% | -0.2% | |
| Svcs ex Energy | 1.7% | 54.33% | 1.8% | 71% | 2.3% | 2.4% | 0.1% | |
| Svcs ex E & Shelter | 0.5% | 2.1% | 2.9% | 3.0% | 0.0% | |||
| Core less Tobacco | 0.6% | 1.4% | 2.1% | 1.9% | 0.1% | |||
| Food & Energy | ||||||||
| Energy | 169.7% | 7.68% | 27.5% | -2.9% | 1.5% | 8.6% | ||
| Food | 2.5% | 15.22% | 1.8% | 1.7% | 2.0% | 0.2% | ||
| Red values indicated inflation pickup from previous period in table above | ||||||||
Robert Brusca
AuthorMore in Author Profile »Robert A. Brusca is Chief Economist of Fact and Opinion Economics, a consulting firm he founded in Manhattan. He has been an economist on Wall Street for over 25 years. He has visited central banking and large institutional clients in over 30 countries in his career as an economist. Mr. Brusca was a Divisional Research Chief at the Federal Reserve Bank of NY (Chief of the International Financial markets Division), a Fed Watcher at Irving Trust and Chief Economist at Nikko Securities International. He is widely quoted and appears in various media. Mr. Brusca holds an MA and Ph.D. in economics from Michigan State University and a BA in Economics from the University of Michigan. His research pursues his strong interests in non aligned policy economics as well as international economics. FAO Economics’ research targets investors to assist them in making better investment decisions in stocks, bonds and in a variety of international assets. The company does not manage money and has no conflicts in giving economic advice.


