 Global| Jun 27 2008
Global and EMU Money Supply Slows…but Gradually
Summary
Money growth is slowing on a gradual pace. In EMU credit growth is slowing more rapidly, undoubtedly helped along by banks’ own credit tightening moves. The table shows that nominal money supply growth rates are slowly deteriorating [...]
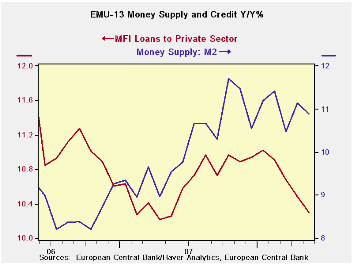
Money growth is slowing on a gradual pace. In EMU credit
growth is slowing more rapidly, undoubtedly helped along by banks’ own
credit tightening moves.
The table shows that nominal money supply growth rates are
slowly deteriorating in various key money-center countries. The growth
in real balances (inflation adjusted money and credit amounts) is
decelerating faster than for nominal balances as the domestic price
level has shot up across all these nations even as nominal money growth
has slowed. We show the increase in the price of oil (WTI) to the far
right of the table.
Money and credit slow…
In EMU money and credit real balance growth (bottom of the table) is in
the 4% to 5% range over three months compared to the 7% to 8% range
over 12-months. In the US, the UK and Japan money growth is in the 0.5%
to 2% range over three months. In each case there is a deceleration
from the 12-month pace that is significant. These are growth-impeding
polices.
Policy risks may not be what they seem…
A slowing stimulus from real balances will help to slow growth in these
countries. Meanwhile, the myriad factors that remain in play from high
energy prices to banking sector problems continue to crimp growth. At
this point real money balances are simply slowing but their growth
rates remain positive. Still, there could be a substantial dose of
slowing that is in the pipeline from current policy restrictiveness due
to sluggish real balance growth let alone any tighter policy.
Still central banks are focused on interest rates and real
interest rates as they struggle to keep inflation expectations
‘anchored’. The ECB that places more weight on money and credit
aggregates than does the Fed in the US has the aggregates that are
growing the fastest even when adjusted for the effects of inflation.
The ECB is preparing to hike rates, a move that should further slow
money and credit growth there and could pressure other countries to
follow suit event though they seem farther along the road to credit
restrictiveness than the ECB – despite the fact that other countries
have cut rates when the ECB has not.
Too easy or too tight?
Based on the actual slowing of real balances the risk of being too
tight with policy seems quite plausible despite the obvious worry in
the tone from central banks that are concerned with inflation that is
over the top of its target ceiling or guideline. Slippage in inflation
expectations is not a price that any central bankers are wiling to pay.
But the policy risk now may be turning to the potential for overkill on
the side of restrictiveness when the credit crunch and depressing
effect of oil prices are both fully accounted for. Don’t look for it in
many central bank speeches, however. So far, only the UK’s Mervyn King
has said explicitly that to get control of inflation will require
slowing growth. He had previously said that controlling inflation would
involve pain. In the US its dual mandate does not allow the Fed
purposefully dish out pain to slow inflation. So look for the Fed’s
analysis of the economy to be too-cheery in order to permit it to be
tighter than it needs to be. The Fed is already cheerily saying that
spending has firmed, while it has jettisoned language about expecting
oil prices to flatten or fall yet it still expects inflation to fall.
Nice if you can get it. But will it be that simple?
| Look at Global and Euro Liquidity Trends | |||||||
|---|---|---|---|---|---|---|---|
| Saar-all | Euro Measures (E13): Money & Credit | G-10 Major Markets: Money | Memo | ||||
| €€-Supply M2 | Credit: Residential |
Loans | $US M2 | ££UK M4 | ¥¥Jpn M2+Cds | OIL:WTI | |
| 3-MO | 9.2% | 9.0% | 8.5% | 5.5% | 7.3% | 0.7% | 203.4% |
| 6-MO | 10.0% | 10.9% | 9.8% | 7.9% | 10.8% | 2.0% | 73.0% |
| 12-MO | 10.9% | 12.0% | 10.3% | 6.3% | 10.1% | 2.0% | 96.5% |
| 2Yr | 10.2% | 11.4% | 10.3% | 6.3% | 12.0% | 1.7% | 32.8% |
| 3Yr | 9.9% | 11.7% | 10.8% | 5.8% | 11.8% | 1.6% | 35.9% |
| Real Balances: deflated by Own CPI. Oil deflated by US CPI | |||||||
| 3-MO | 4.9% | 4.7% | 4.2% | 0.6% | 2.2% | 0.7% | 189.2% |
| 6-MO | 6.2% | 7.2% | 6.1% | 3.7% | 5.9% | 1.6% | 66.3% |
| 12-MO | 7.0% | 8.0% | 6.4% | 2.2% | 6.5% | 1.2% | 88.8% |
| 2Yr | 7.2% | 8.4% | 7.3% | 2.8% | 8.7% | 1.3% | 28.4% |
| 3Yr | 7.1% | 8.8% | 7.9% | 2.1% | 8.9% | 1.3% | 31.2% |

Robert Brusca
AuthorMore in Author Profile »Robert A. Brusca is Chief Economist of Fact and Opinion Economics, a consulting firm he founded in Manhattan. He has been an economist on Wall Street for over 25 years. He has visited central banking and large institutional clients in over 30 countries in his career as an economist. Mr. Brusca was a Divisional Research Chief at the Federal Reserve Bank of NY (Chief of the International Financial markets Division), a Fed Watcher at Irving Trust and Chief Economist at Nikko Securities International. He is widely quoted and appears in various media. Mr. Brusca holds an MA and Ph.D. in economics from Michigan State University and a BA in Economics from the University of Michigan. His research pursues his strong interests in non aligned policy economics as well as international economics. FAO Economics’ research targets investors to assist them in making better investment decisions in stocks, bonds and in a variety of international assets. The company does not manage money and has no conflicts in giving economic advice.
More Economy in Brief


