 Global| Aug 17 2007
German PPI Steadies at Above 2% Pace
Summary
Trends in German producer prices are partly favorable. Excluding energy, manufacturing PPI trends are sideways. The year- over-year rate has showed a slight downtrend while the six- month rate has popped up and the 3-month rate has [...]
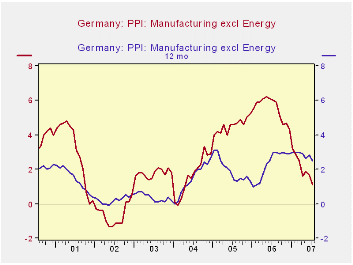
Trends in German producer prices are partly favorable.
Excluding energy, manufacturing PPI trends are sideways. The year- over-year rate has showed a slight downtrend while the six- month rate has popped up and the 3-month rate has dropped from its month-ago pop-up. The three- month trend is unclear as despite its drop-off in the month it may still be in an uptrend that dates back to March. Prices of German manufacturing and mfg excluding energy show different forces are acting on them. As energy prices have ebbed overall German PPI inflation is dropping and has slowed to a 1.1% pace year/year. But the year/year pace for the Excl Energy Manufacturing PPI inflation rate is at 2.5% and is barely beginning to edge lower. With the ECB inflation ceiling for its HICP at 2% the PPI is not helping and the trend does not show the promise of much help to come, at least for nonenergy prices.
| M/M % Changes | %-SAAR | ||||||
| Jul-07 | Jun-07 | May-07 | 3-mo | 6-mo | 12-mo | 12-moY-Ago | |
| MFG | -0.1% | 0.3% | 0.3% | 2.0% | 1.9% | 1.1% | 6.0% |
| Ex Energy | 0.1% | 0.4% | 0.2% | 2.6% | 2.6% | 2.5% | 3.0% |
by Carol Stone August 17, 2007
We speak often about oil demand, in which regions it has grown and where it is more restrained and how can we use oil more efficiently. But price, of course, results from both demand AND supply. So discussion of oil markets is not really complete without some consideration of supply conditions. Even if we believe supply is exogenous to consumers, we still need to understand how much is coming from where.
These details are arrayed nicely in Haver's OMI database, furnished by our partner source, Energy Intelligence, as part of their publication "Oil Market Intelligence". This company has representatives in fields around the world to assess the availability of this important resource.
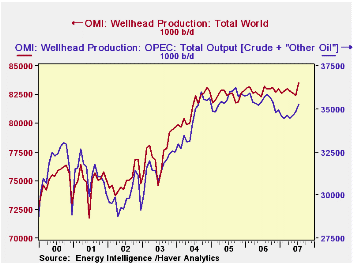
In July total oil available from wellhead production was 83,530 thousand barrels/day, compared with 82,434 in June and 83,266 in July 2006. For this July, there were also refining processing gains of approximately 2,000 barrels/day, so the supply of products was about in line with the separately measured product demand, 85,482 thousand barrels/day. The increase in supply for the month was 1.33%, the largest monthly rise since 1.73% in June 2004.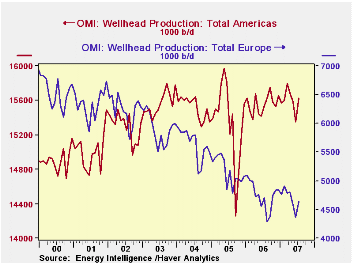
Among the leading producers, OPEC output was 35.3 million b/d, up from 34.8 mbd in June. It represents 42.2% of total world output. In recent years, OPEC's largest share was 44.3% in September 2005. For much of the time since 1990, their share hovered around 40%; it began to increase from that range during 2002.
In examining the other regions' performance, it looks that higher prices are eliciting added output. Nearly every other major area of the world is participating, at least to some extent. Many of us tend to think that the "oil is running out", but there seems still to be some more. The most distinctive example is the new UK field in the North Sea. For all of Europe, this appears to have halted the steep downtrend in output, making it just about steady in July with the year-ago figure, off a mere 1.3%, compared with year-on-year declines last autumn of 10% and more. In the Americas, production is climbing slowly after the plunge and rebound associated with 2005's hurricanes; it's even steady in the US, and "other" countries, though small, are growing rapidly.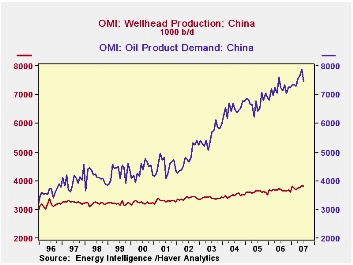
The main growth is in Asia. The OMI classifies Russia as an Asian producer. Its output is rising at about a 2.2% year-on-year pace and now accounts for about 11.6% of the world total. Other former Soviet republics are growing their output rapidly, albeit from a small base; they have enlarged their market share by 0.75% in just the past two years. In China, production is growing, but demand is growing so much faster. This imbalance is likely one reason for recent price spikes.
| World Oil Supply, Mil. Bbl/Day |
July 2007 | June 2007 | May 2007 | July 2006 | 2006 | 2005 | 2004 |
|---|---|---|---|---|---|---|---|
| Total | 83.5 | 82.4 | 82.6 | 83.3 | 82.9 | 82.4 | 81.4 |
| OPEC | 32.3 | 34.8 | 34.6 | 35.7 | 35.4 | 35.6 | 34.4 |
| Americas | 15.6 | 15.3 | 15.6 | 15.5 | 15.6 | 15.4 | 15.5 |
| Europe | 4.6 | 4.4 | 4.6 | 4.7 | 4.7 | 5.2 | 5.6 |
| Russia | 9.7 | 9.6 | 9.6 | 9.5 | 9.4 | 9.2 | 9.0 |
| Other Asia | 9.0 | 8.9 | 8.9 | 8.6 | 8.5 | 8.2 | 8.1 |
by Tom Moeller August 17, 2007
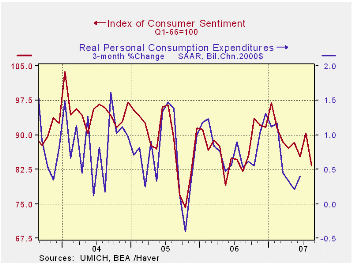
The University of Michigan's preliminary reading of consumer sentiment in August fell 7.9% m/m to 83.3. The decline was the largest m/m drop in over a year and, likewise, pulled the index to its lowest level since last August. Consensus expectations had been for a lesser decline to 87.
A 9.1% decline in consumer expectations led this month's decline in overall sentiment.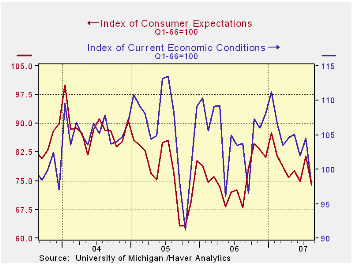
Consumers worried that business conditions during the next six months would deteriorate and the index measuring these expectations fell 14.3% (+20.0% y/y). Expectations for business conditions during the next five years also fell (-7.3% m/m, +6.0% y/y). Finally, the index measuring the expected change in consumers' finances fell 5.6% (+5.4% y/y) and reversed most of the prior month's increase.
Perceptions about current economic conditions also fell. The view of current personal finances fell 13.0% (-8.3% y/y) and consumers' view of current buying conditions for large household goods fell 1.9% (-4.4% y/y).
The assessment of government policy fell a hard 7.0% m/m (-2.4% y/y) to the lowest level in over one year..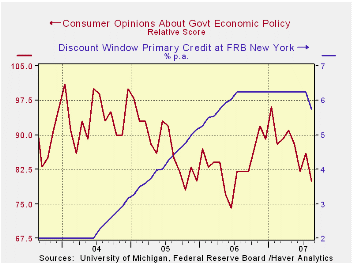
The University of Michigan survey is not seasonally adjusted.The reading is based on telephone interviews with about 500 households at month-end.
The U.S. Federal Reserve today took action to reduce the Discount Rate. An accompanying statement to this action can be found here. Today's actionis meant toencourage the use of the discount window by specific banksthat need more liquidity without reducing the cost of funds toall banks, as an easing of the fed funds rate would do.
William Poole, President, Federal Reserve Bank of St. Louis, spoke today on U.S. Export Opportunities and his comments are available here
| University of Michigan | August (Prelim.) | July | Aug y/y | 2006 | 2005 | 2004 |
|---|---|---|---|---|---|---|
| Consumer Sentiment | 83.3 | 90.4 | 1.6% | 87.3 | 88.5 | 95.2 |
| Current Conditions | 97.7 | 104.5 | -5.9% | 105.1 | 105.9 | 105.6 |
| Expectations | 74.1 | 81.5 | 9.0% | 75.9 | 77.4 | 88.5 |

Robert Brusca
AuthorMore in Author Profile »Robert A. Brusca is Chief Economist of Fact and Opinion Economics, a consulting firm he founded in Manhattan. He has been an economist on Wall Street for over 25 years. He has visited central banking and large institutional clients in over 30 countries in his career as an economist. Mr. Brusca was a Divisional Research Chief at the Federal Reserve Bank of NY (Chief of the International Financial markets Division), a Fed Watcher at Irving Trust and Chief Economist at Nikko Securities International. He is widely quoted and appears in various media. Mr. Brusca holds an MA and Ph.D. in economics from Michigan State University and a BA in Economics from the University of Michigan. His research pursues his strong interests in non aligned policy economics as well as international economics. FAO Economics’ research targets investors to assist them in making better investment decisions in stocks, bonds and in a variety of international assets. The company does not manage money and has no conflicts in giving economic advice.
More Economy in Brief


