 Global| Mar 20 2019
German PPI Falls and the Trend Continues to Deteriorate
Summary
While conservative central bankers (pardon the redundancy) continue to worry about the prospect for inflation to surge, global inflation reports continue to undershoot these fears. The latest example of this is in Germany where PPI [...]
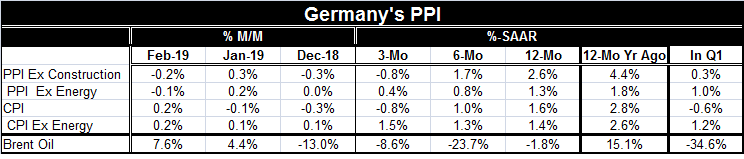
 While conservative central bankers (pardon the redundancy) continue to worry about the prospect for inflation to surge, global inflation reports continue to undershoot these fears. The latest example of this is in Germany where PPI acceleration had been feared; instead the month-to-month PPI change was negative dropping by 0.2%. The headline for that gauge shows an ongoing progression to a slower pace over shortening horizons.
Year-on-year the German PPI rises by 2.6%. Over six months it gains at a reduced pace of 1.7% while over three months the annualized rate of change is -0.8%. Over three months the German PPI is dropping, not accelerating.
Of course, the headline PPI is relatively more affected by oil prices. And while oil prices have begun to firm, the firming is nascent. Even over three months Brent oil prices are lower on balance despite gains in each of the last two months.
Still, if we strip out energy and look at the shorn PPI, we find that the ex-energy PPI for Germany is also decelerating. It gains 1.3% over 12 months and rises at a 0.8% pace over six months then rises at an even more modest 0.4% over three months; no acceleration there either. Where’s Waldo?
Even so, the headline PPI gain year-over-year in Germany was 2.6% in February, the same as it was in January. But January was a deceleration from December and December was a deceleration from November. German inflation had a mini peak at 3.3% in November-December of 2018.
The German ex-energy inflation rate over 12 months also was unchanged in February, stuck at its January pace of 1.3%. But ex-energy inflation ran at a pace of 1.6% in three of four months from December-September of 2018. It had a local mini-peak at 2% in June 2018 but generally ran at an even faster pace from January 2017 to January 2018. But that was a after an extended period from early 2013 through October 2016 when the PPI did not gain even 2% year-over-year and was mostly falling.
What are these fears of inflation based on? The most logical culprit is Keynesian economics and its focus on bottlenecks. Unemployment has fallen significantly in the EMU and is at or near record –or long time- lows in the U.S., Germany, and the U.K. Unemployment is also low in Japan. The length of the business expansion also feeds into this fear although we are always told that recoveries do not die of old age. The real fear is that an older recovery has an economy with less slack and has used up the best capital and labor and begins to dig too deep in the labor pool giving rise to wage gains and inflation. Except there is no evidence (very little evidence) that such a thing is happening; still, that seems to be the fear. There is a lesson here: never let rationality get in the way of your entrenched fears…
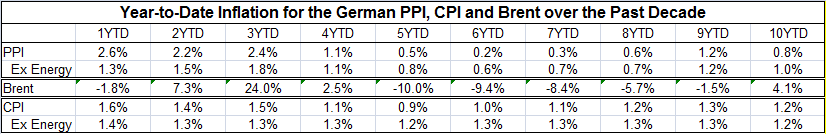
The table below reminds us that on a year-to-date basis, inflation has been unequivocally tempered, subdued and tame and has been for at least a decade. The table shows what inflation has been year-to-date for all 12-month periods from today back 10-years. We find the PPI has a range of 2.2% to 2.6% over the last three years and is at 1.1% or below on all longer horizons. Over the past decade PPI inflation year-to-date has been under 1%. Ex-energy PPI inflation has been in a range of 1.3% to 1.8% over the last three years and that range is now titling to the lower end; over all previous 12-month periods back 10-years the ex-energy PPI pace is no higher than 1.2%. If inflation is fire, this degree of heat would not light kindling.
I include oil in the table below (Brent crude prices) to help to show its role. Oil prices are up by a sharp 24% year-to-date over the last three years, obviously having something to do with the ‘elevated’ headline PPI reading of 2.2% to 2.6% in recent years. But since ex-energy inflation is less affected by oil, ex-energy prices remained tempered in this period and that is even more impressive. Year-to-date energy prices are negative for all year-to-date periods from 5-years to 9-years but over 10-years energy prices are up at 4.1% annual rate. That means that based on the oil price that existed 10-year ago, today Brent prices today correspond to a compounded annual rate of increase over those ten years of 4.1%. That means that the 10-year-to-date PPI is not all that helped by oil prices even though it may have been for several sub-periods.
The point is that oil prices are coming out of a weak spot and creating more of a broad flat spot. And while oil can have a pronounced impact on the PPI headline, ex-energy prices are today, as they have been over the past ten years, very restrained. Are central bankers simply waiting for Godot? Earlier this year we saw the ECB was ready to shift to less accommodation and then it was forced to scale back its plans when economic weakness emerged instead of inflation. In the U.S., the Fed has truncated its ongoing profile of fed funds rate hikes, injecting a period of stability for rates into the mix instead. Maybe central bankers still are worrying about the wrong things? The yield curve in the U.S. is the most visible sign telling us that there is nothing to worry about on the inflation front. Unfortunately, the yield curve is one of things that the Fed tolerates more than it pays attention to. Could central bankers wind up paying a price for that?
 Note the Stability of the ex-energy CPI
Robert Brusca
AuthorMore in Author Profile »Robert A. Brusca is Chief Economist of Fact and Opinion Economics, a consulting firm he founded in Manhattan. He has been an economist on Wall Street for over 25 years. He has visited central banking and large institutional clients in over 30 countries in his career as an economist. Mr. Brusca was a Divisional Research Chief at the Federal Reserve Bank of NY (Chief of the International Financial markets Division), a Fed Watcher at Irving Trust and Chief Economist at Nikko Securities International. He is widely quoted and appears in various media. Mr. Brusca holds an MA and Ph.D. in economics from Michigan State University and a BA in Economics from the University of Michigan. His research pursues his strong interests in non aligned policy economics as well as international economics. FAO Economics’ research targets investors to assist them in making better investment decisions in stocks, bonds and in a variety of international assets. The company does not manage money and has no conflicts in giving economic advice.
More Economy in Brief


