 Global| Oct 07 2009
German Orders Growth Extended
Summary
Order Trends: German new orders growth was extended as foreign orders snapped back after a one-month decline. Domestic orders fell by 1.9% after surging by 9.5% in July. Orders have been rising steadily, strongly, over the past six [...]
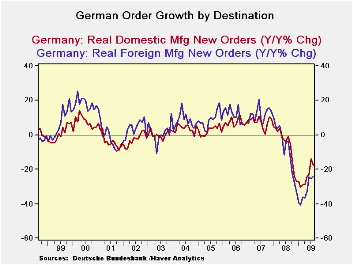
Order Trends: German new orders growth was
extended as foreign orders snapped back after a one-month decline.
Domestic orders fell by 1.9% after surging by 9.5% in July. Orders have
been rising steadily, strongly, over the past six months with domestic
orders up in five of those six months and foreign orders up in four of
those six months. Both series are showing continuing acceleration not
just growth. In the current quarter domestic orders are outpacing on
the back of a one month 9.5% spurt in orders in July as the new quarter
began.
Foreign order sources: Orders from
countries outside the euro zone alone jumped 5.9%, in August while
foreign demand for German manufactured goods from the other 15
countries sharing the euro rose by just 2.8% in August from the month
earlier. Growth outside of the e-Zone drove German orders this past
month.
Euro-Area policy cuts no slack - Apart
from orders, the European Commission Wednesday warned nine countries,
including Germany, that their budget deficits are too large. This is
the legacy effect of having used domestic deficit spending to bolster
the economy in the recession. That policy response was good thing, but
it now puts those countries afoul of EU Commission rules.
Out of touch with reality? The warning
comes at an odd time since Euro-central bankers and policy officials in
the US have underscored that the time is not right to withdraw
stimulus. Hanging the ‘Sword of Damocles’ over the heads of the various
ECB nations does not seem like the right policy tilt to encourage them
to keep their stimulus efforts in place. It sounds a lot like pressure
to get you house in order NOW! The EU Commission is using bad judgment
and being too strict on rules of evaluations at a time like this. Yes
it is just this sort of thinking that keeps the euro strong but it also
unduly complicates and hampers policy. This stance reminds me of the
ECB’s problems in cutting rates in timely fashion in the recession. The
target rate ceiling on the HICP hampered the ECB in the pits of the
crisis. It cut rates as a part of an ‘international effort’, using that
as an excuse to cut rates with headline inflation well over its ceiling
at the time. I suppose we are to understand that this warning from the
EU Commission as a formality that has come as scheduled. But in times
such as these what is the merit? Does this act brand the EU Commission
tough or as out of touch?
| German Orders and Sales By Sector and Origin | ||||||||
|---|---|---|---|---|---|---|---|---|
| Real and SA | % M/M | % Saar | ||||||
| Aug-09 | Jul-09 | Jun-09 | 3-Mo | 6-Mo | 12-Mo | Year Ago | QTR-2-Date | |
| Total Orders | 1.4% | 3.1% | 3.8% | 38.7% | 17.8% | -21.1% | -2.4% | 43.7% |
| Foreign | 4.6% | -2.4% | 6.9% | 42.1% | 19.2% | -24.0% | -3.8% | 30.7% |
| Domestic | -1.9% | 9.5% | 0.5% | 35.5% | 16.4% | -17.6% | -0.9% | 59.5% |
| Real Sector Sales | ||||||||
| MFG/Mining | 2.7% | -0.5% | 1.1% | 13.8% | 6.7% | -16.6% | 1.8% | 14.4% |
| Consumer | 0.4% | -0.7% | 0.1% | -0.8% | -0.4% | -8.4% | -3.0% | -4.8% |
| Consumer Durables | 1.6% | 0.5% | -2.6% | -2.3% | -1.1% | -20.6% | -1.8% | 3.8% |
| Consumer Nondurable | 0.2% | -0.9% | 0.5% | -0.8% | -0.4% | -6.2% | -3.2% | -6.3% |
| Capital Goods | 4.2% | -2.0% | 1.4% | 15.4% | 7.4% | -20.9% | 4.8% | 18.7% |
| Intermediate Goods | 2.5% | 1.3% | 1.6% | 23.9% | 11.3% | -16.2% | 1.0% | 22.9% |
| All Manufacturing Sales | 2.6% | -0.5% | 1.2% | 13.8% | 6.7% | -16.9% | 1.9% | 14.3% |
Several Indicators Signal U.S. Inflationary Upturn
by Tom Moeller October 7, 2009
Liquidity has long been viewed as having the potential for fueling inflationary problems for an economy. Before that problem actually emerges, several "market-based" indicators help provide a market view of the pricing outlook. While hardly precise, the figures do give a measure of risk. Some view that risk as an outgrowth of how much liquidity there is in the economy, and by all measures, inflationary pressures are set to rise.
 So far, the inflationary environment has been tame. Through
August, lower oil prices dropped the y/y change in the CPI to -1.4%
although recent gains in prices have raised the three-month rate to
4.9%. During that period "core" prices power fell to 1.5% on both a
twelve and three-month basis, down from a high of 2.9% during the
summer of 2006.
So far, the inflationary environment has been tame. Through
August, lower oil prices dropped the y/y change in the CPI to -1.4%
although recent gains in prices have raised the three-month rate to
4.9%. During that period "core" prices power fell to 1.5% on both a
twelve and three-month basis, down from a high of 2.9% during the
summer of 2006.
Let's look at five market-based harbingers of future inflation.
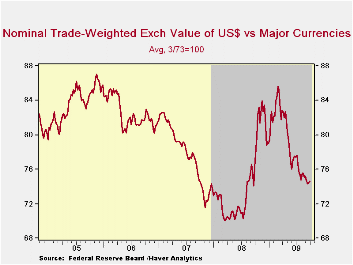
 First, the dollar is an indicator of a potential inflationary
threat in that it raises the prices of imported goods relative to
domestically made products. The dollar has been under significant
pressure recently as the weak U.S. economy has forced the Federal
Reserve to lower interest rates to near-zero from above 5% in 2007.
Certainly, recessions abroad have forced rates lower there as well. The
declines, however, have been not as large as in the U.S.
First, the dollar is an indicator of a potential inflationary
threat in that it raises the prices of imported goods relative to
domestically made products. The dollar has been under significant
pressure recently as the weak U.S. economy has forced the Federal
Reserve to lower interest rates to near-zero from above 5% in 2007.
Certainly, recessions abroad have forced rates lower there as well. The
declines, however, have been not as large as in the U.S.
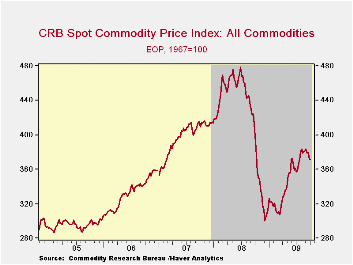
Next, gold & commodity prices give signals of potential inflationary threats. They do not feed directly significantly into product prices, but rather they can be a measure of the market's inflationary psychology. To that end, gold recently has jumped to a record $1,040 per ounce, up 14% y/y. Copper prices also have been strong. They have doubled since December while aluminum prices have risen by one-half.
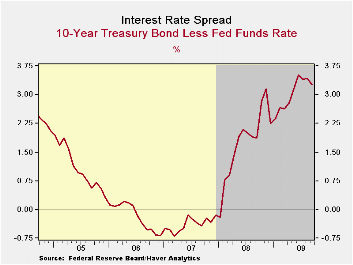
The interest rate
yield curve gives yet another reading of inflationary psychology in the
credit market. Following inversion as recently as late-2007 the spread
has widened to over 300 basis points, though it recently has narrowed
slightly. Also providing an indication of inflationary risk is the
market for TIPS, or Treasury inflation-protected securities. Recently,
that signal has stabilized after a sharp upturn this spring. From the
U.S. Federal Reserve, two papers discuss the value of TIPS. One, The
TIPS Yield Curve and Inflation Compensation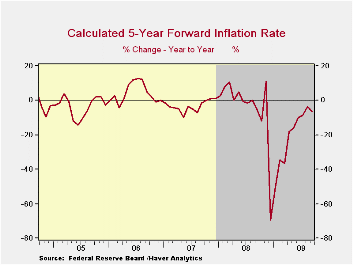
Money supply growth also can fuel inflation, directly through a heightened demand for goods and services, or just through increased liquidity. The Fed raised the growth rate in M2 to nearly 20% in the aftermath of the crash in stock prices last year. Instead of spending, consumers have chosen to lift their savings to a 3-4% rate from one percent early last year. Lately, money growth has been scaled back radically to near zero or less. In tandem, growth in the monetary base has been dropped. Nevertheless, the liquidity provided earlier by the Fed has not been drained.
What is money being used for? A measure of the degree to which
money is being spent or that savings are being rebuilt is the velocity
of money, i.e., the ratio of GDP to the money supply. Here the message
is clear. Recent money creation is being used for personal liquidity
rather than spending power. The ratio recently continued its collapse
and fell to 8.6 from its high near 10.5 last year.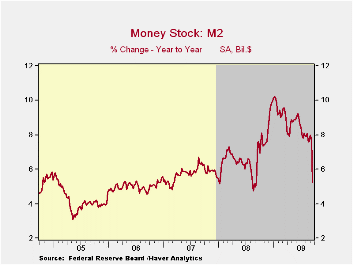 Velocity tends to
fall during periods of declining interest rates and the recent decline
has been to the lowest level since the recession of 2001.
Velocity tends to
fall during periods of declining interest rates and the recent decline
has been to the lowest level since the recession of 2001.
So far, the pieces of the puzzle suggest a coming problem of rising prices. What could diffuse this problem is a concerted effort by the Fed to rein in the growth of money. That may already have begun as indicated by no growth in M2 since the spring. However, that's only one of the above measures that points to a diminished inflationary threat. Thus, more aggressive action seems warranted. Recent speculation of the Fed delaying an interest rate increase until later next year is not encouraging.
U.S. Consumer Credit Outstanding Continues To Fall
by Tom Moeller October 7, 2009
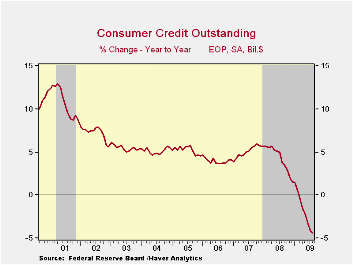 There's
been no let-up in the deleveraging of consumer balance sheets. For the
seventh consecutive month, the Federal Reserve reported that consumer
credit outstanding has fallen. During August, it was down by $12.0, or
4.0% y/y, and the sharper July decline was revised only slightly
shallower. The latest was the eleventh since last summer. The magnitude
of the cutbacks continues to impress as the y/y change amounted to a
record 4.4% drop. Double-digit monthly declines have prevailed all this
year. The latest decline was roughly double expectations.
There's
been no let-up in the deleveraging of consumer balance sheets. For the
seventh consecutive month, the Federal Reserve reported that consumer
credit outstanding has fallen. During August, it was down by $12.0, or
4.0% y/y, and the sharper July decline was revised only slightly
shallower. The latest was the eleventh since last summer. The magnitude
of the cutbacks continues to impress as the y/y change amounted to a
record 4.4% drop. Double-digit monthly declines have prevailed all this
year. The latest decline was roughly double expectations.
Usage of
non-revolving credit (autos & other consumer durables), which
accounts for nearly two-thirds of the total, fell $2.1B after the
record $16.6B July drop. The 2.4% y/y decline is near the record.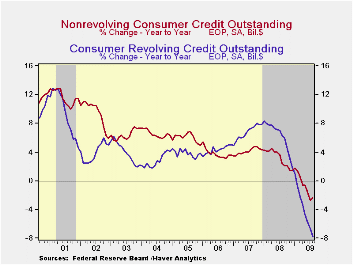 Additionally weighing on overall credit has been the tight rein on
revolving credit usage. During August, revolving credit outstanding
fell a near-record $9.9B for the eleventh consecutive monthly drop.
Year-to-year the 7.8% decline is by far the record as consumers left
their credit cards in their wallets.· With these declines, consumers
have been successful in reducing credit outstanding as a percentage of
disposable income to 22.6% from its 2005 high of 24.4%. This compares
to the low near 16% in the early-1990s. Now that the
"shop-till-you-drop" mantra has been diffused by the aging population
of the U.S., a return to a permanently lower level of credit usage is
likely.
Additionally weighing on overall credit has been the tight rein on
revolving credit usage. During August, revolving credit outstanding
fell a near-record $9.9B for the eleventh consecutive monthly drop.
Year-to-year the 7.8% decline is by far the record as consumers left
their credit cards in their wallets.· With these declines, consumers
have been successful in reducing credit outstanding as a percentage of
disposable income to 22.6% from its 2005 high of 24.4%. This compares
to the low near 16% in the early-1990s. Now that the
"shop-till-you-drop" mantra has been diffused by the aging population
of the U.S., a return to a permanently lower level of credit usage is
likely.
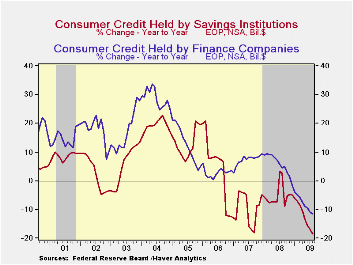 Finance
companies (-11.5% y/y) and savings institutions
(-18.5% y/y) have seen the largest pullbacks in credit extension while
commercial banks (+0.1% y/y) and credit unions continue to see
positive, though diminished growth. The Federal government and Sallie
Mae continued to lend during August by 20.6% y/y which was the
strongest growth rate since early 1991.
Finance
companies (-11.5% y/y) and savings institutions
(-18.5% y/y) have seen the largest pullbacks in credit extension while
commercial banks (+0.1% y/y) and credit unions continue to see
positive, though diminished growth. The Federal government and Sallie
Mae continued to lend during August by 20.6% y/y which was the
strongest growth rate since early 1991.
These figures are the major input to the Fed's quarterly Flow of Funds accounts for the household sector.
Credit data are available in Haver's USECON database. The Flow of Funds data are in Haver's FFUNDS database.
Predicting Crises, Part II: Did Anything Matter (to Everybody)? from the Federal Reserve Bank of San Francisco can be found here.
| Consumer Credit Outstanding (m/m Chg, SAAR) | August | July | Y/Y | 2008 | 2007 | 2006 |
|---|---|---|---|---|---|---|
| Total | $-12.0B | $-15.0B | -4.0% | 1.6% | 5.6% | 4.1% |
| Revolving | $-9.9B | $-2.4B | -7.8% | 1.9% | 7.8% | 5.0% |
| Non-revolving | $-2.1B | $-16.6B | -2.4% | 1.4% | 4.4% | 3.6% |

Robert Brusca
AuthorMore in Author Profile »Robert A. Brusca is Chief Economist of Fact and Opinion Economics, a consulting firm he founded in Manhattan. He has been an economist on Wall Street for over 25 years. He has visited central banking and large institutional clients in over 30 countries in his career as an economist. Mr. Brusca was a Divisional Research Chief at the Federal Reserve Bank of NY (Chief of the International Financial markets Division), a Fed Watcher at Irving Trust and Chief Economist at Nikko Securities International. He is widely quoted and appears in various media. Mr. Brusca holds an MA and Ph.D. in economics from Michigan State University and a BA in Economics from the University of Michigan. His research pursues his strong interests in non aligned policy economics as well as international economics. FAO Economics’ research targets investors to assist them in making better investment decisions in stocks, bonds and in a variety of international assets. The company does not manage money and has no conflicts in giving economic advice.
More Economy in Brief


