 Global| Aug 07 2007
German IP Weakens as Orders Surge
Summary
For the full quarter total German IP is up by 0.3%. Construction is off by 31% at an annual rate in Q2, accounting for much of the drag. But MFG is up by 0.8% roughly the same as for consumer goods, intermediate goods and capital [...]
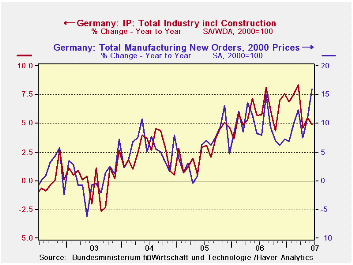
For the full quarter total German IP is up by 0.3%. Construction is off by 31% at an annual rate in Q2, accounting for much of the drag. But MFG is up by 0.8% roughly the same as for consumer goods, intermediate goods and capital goods output. Of course in Q2 2007 German orders are up at a spectacular 17.6% annual rate.
The accompanying graph shows that orders often peak at the same time or before industrial output (note that that is a two-scale chart). In that sense the ongoing rise in orders is reassuring. From Nov 2006 through Jan 2007 orders growth did slip below the pace of growth for output. This event is coincident with the year-end/new year period when the VAT hike was initiated and that tax accounted for some uncertainty at the time. Uncertainty seems to have interrupted the flow of new orders more than of output because what we see is that the flow of orders was interrupted at that time but the growth of output was not. Now however there is a lull in output in Q2 as orders have sped ahead. The reasonable question to ask is whether this is some sort of catch up in orders after that year-end lull when IP was stronger than orders – since that is an unusual configuration for these two series, to have output stronger than orders. Or is the new spurt in orders entirely of a different cause and does it point to even stronger gains in IP for the period ahead?
At this time most Europeans are very upbeat and no end of laudatory statements have been made about Euro-growth and growth prospects. But the fact remains that some Euro area members are not doing so well and that even for Germany much of this strength in orders comes from cross-border transactions. The latter trend seems to imply that the spurt in orders is for real and reflects some new demand phenomenon. But the UK has also turned in some hot/cold signals recently and Italy is showing a protracted period of anemia. France benefited from elections and post-election euphoria and it is not clear that it will continue to have so much good news to buoy its spirits in the period ahead. Sarkozy can only keep pointing his finger at others as the source of the problem for so long until one day he steps in front of a mirror.
I think the series of German reports from the Zew and IFO indexes peaking to the flap about IP in Germany to some irregular signals from the UK as well as ongoing weakness in Italy point to some real world problems creeping into the Euro area. Europe still does not have a flexible economy. The US is still clearly the leader on that score. The raft of mini-problems or question marks arising in Europe I believe will prove to have some real causes behind them.
| SAAR except M/M | Jun-07 | May-07 | Apr-07 | 3-month | 6-month | 12-month |
| IP total | -0.4% | 1.9% | -1.5% | 0.0% | 2.8% | 4.9% |
| Consumer Goods | -2.5% | 1.3% | -0.9% | -8.2% | -1.5% | 1.9% |
| Capital Goods | -0.9% | 2.1% | -1.1% | 0.3% | 6.7% | 7.1% |
| Intermediate Goods | 0.8% | 2.1% | -2.1% | 3.0% | 4.5% | 7.5% |
| Memo: Construction | -2.1% | 0.2% | -5.6% | -26.5% | -17.0% | -3.7% |
by Louise Curley August 7, 2007
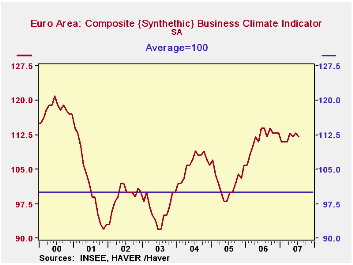
A number of Euro Area countries have reported wavering business confidence in July. Today, France's INSEE (Institute National de la Statistiques et des Etudes Economiques) released its measure of business confidence for the area as a whole. The measure declined in July to 112 from 113 in June and is below the recent peak of 114 last seen in September, 2006. Confidence, however, appears to be plateauing rather than declining sharply as at previous peaks, as can be seen in the first chart.
One of the reasons that might explain the fact that business confidence in the Euro Area has not gone off the cliff is that such factors as the slowdown in the U. S. and the rise in the Euro, which would ordinarily weaken confidence, have been offset by the rise in the demand for European exports from Asia. The second chart shows the Euro Area exports to Asia and to the U. S. In addition, as we noted yesterday German manufacturing orders from other Euro Area countries have recently risen sharply. This suggests that intra Euro Area activity, which is not affected by changes in the euro, is increasing. 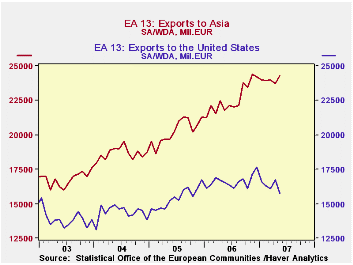
Note: The European Business Confidence measure is based on six balance of opinion indicators: production over the past three months, production forecast for the next three months, inventories, order books, foreign order book and selling price expectations. The data are gathered from surveys in France, Germany, Italy, Spain, the Netherlands and Belgium. These six countries account for about 90% of the total Euro Area's GDP. The measure is conducted so that its average is 100 and has a standard deviation of 10..
| EURO AREA | Jul 07 | Jun 07 | May 06 | Apr 06 | Mar 06 | Feb 06 | Jan 06 | 2006 | 2005 | 2004 |
|---|---|---|---|---|---|---|---|---|---|---|
| Business Confidence | 112 | 113 | 112 | 113 | 111 | 111 | 111 | 112 | 102 | 106 |
| Euro Area Exports (Mil Euro) | ||||||||||
| To Asia | -- | -- | 24275 | 23754 | 23970 | 23915 | 24004 | 277184 | 243246 | 233896 |
| To U. S. | -- | -- | 16603 | 16320 | 16099 | 16754 | 15743 | 199521 | 184992 | 172546 |
by Tom Moeller August 7, 2007
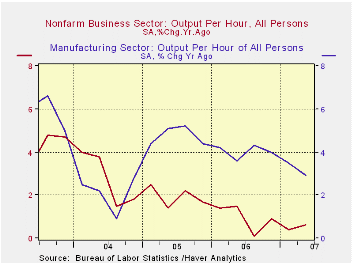
Growth in non-farm labor productivity of 1.8% last quarter fell a bit short of Consensus forecasts for a 2.1% increase but it was the fastest since a 2.5% rise during 1Q06. The gain was up from the revised 0.7% increase during the first quarter but the average of the two at 1.2% barely exceeds the 1.0% gain last year and falls well short of 2.7% growth during 2004.
What Happened to the Gains From Strong Productivity Growth? from the Federal Reserve Bank of Kansas City can be found here.
Output growth of 4.2% (2.0% y/y) also was the best since 1Q06 and was an acceleration from the 1.5% average of the prior four quarters.
Compensation growth held at an elevated 3.9% (5.2% y/y), the fastest y/y growth since 2000. 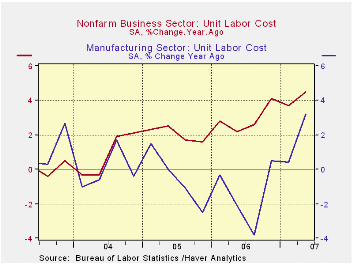
As a result, unit labor costs rose 2.1% during 2Q07 which was down from a 3.0% rise the prior quarter, but the 4.5 gain from the prior year also was the fastest since 2000.
The implicit price deflator rose 2.4% (2.0% y/y) and the increase lifted the ratio of prices to unit labor costs just slightly. It still well below the high during last year. During the last ten years there has been a 59% correlation between the ratio and the y/y growth in corporate profits.
Factory sector productivity grew 1.6% (2.9% y/y, about the same as during the prior quarter. Manufacturing compensation grew 2.8% (6.2% y/y) which was the fastest y/y gain since 2005. And though the 1.2% quarterly gain in unit labor costs was down from 5.0% during 1Q, the y/y gain of 3.2% in factory sector unit labor costs was the fastest since 2000.
| Non-farm Business Sector (SAAR) | 2Q '07 | 1Q '07 | Y/Y | 2006 | 2005 | 2004 |
|---|---|---|---|---|---|---|
| Output per Hour | 1.8% | 0.7% | 0.6% | 1.0% | 1.9% | 2.7% |
| Compensation | 3.9% | 3.7% | 5.2% | 3.9% | 4.0% | 3.6% |
| Unit Labor Costs | 2.1% | 3.0% | 4.5% | 2.9% | 2.0% | 0.9% |
by Tom Moeller August 7, 2007
The rise pulled sales for all of July up 0.4% from June, modest because of many declines during the last eight weeks. During the last ten years there has been a 45% correlation between the y/y change in chain store sales and the change in nonauto retail sales less gasoline.
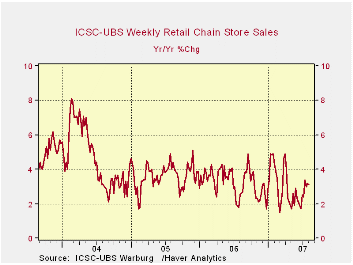
The ICSC-UBS retail chain-store sales index is constructed using the same-store sales (stores open for one year) reported by 78 stores of seven retailers: Dayton Hudson, Federated, Kmart, May, J.C. Penney, Sears and Wal-Mart.
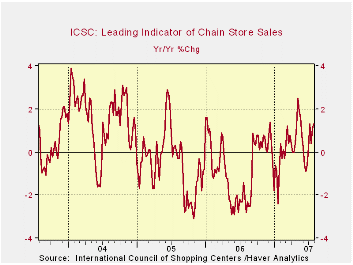
The leading indicator of chain store sales from ICSC-UBS fell 0.7% (+0.2% y/y) last week and gave back much of a 1.2% rise during the prior week.
Evaluating the Relative Strength of the U.S. Capital Markets from the Federal Reserve Bank of New York is available here.
| ICSC-UBS (SA, 1977=100) | 07/28/07 | 07/21/07 | Y/Y | 2006 | 2005 | 2004 |
|---|---|---|---|---|---|---|
| Total Weekly Chain Store Sales | 486.5 | 481.3 | 3.2% | 3.3% | 3.6% | 4.7% |

Robert Brusca
AuthorMore in Author Profile »Robert A. Brusca is Chief Economist of Fact and Opinion Economics, a consulting firm he founded in Manhattan. He has been an economist on Wall Street for over 25 years. He has visited central banking and large institutional clients in over 30 countries in his career as an economist. Mr. Brusca was a Divisional Research Chief at the Federal Reserve Bank of NY (Chief of the International Financial markets Division), a Fed Watcher at Irving Trust and Chief Economist at Nikko Securities International. He is widely quoted and appears in various media. Mr. Brusca holds an MA and Ph.D. in economics from Michigan State University and a BA in Economics from the University of Michigan. His research pursues his strong interests in non aligned policy economics as well as international economics. FAO Economics’ research targets investors to assist them in making better investment decisions in stocks, bonds and in a variety of international assets. The company does not manage money and has no conflicts in giving economic advice.
More Economy in Brief


