 Global| Apr 21 2009
Gasoline Prices Remain Steady Around $2.00 Per Gallon
by:Tom Moeller
|in:Economy in Brief
Summary
Regular gasoline prices last week held firm at $2.06 per gallon, the highest level since last November. The latest was up 42 cents from the December low. On news of a weakening U.S. economy, however, the spot market price for regular [...]
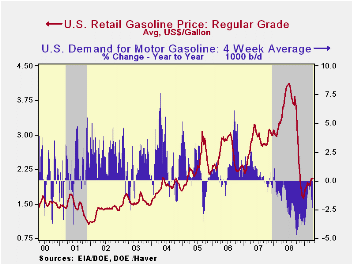
Regular gasoline prices last week held firm at $2.06 per gallon, the highest level since last November. The latest was up 42 cents from the December low. On news of a weakening U.S. economy, however, the spot market price for regular gasoline slipped to $1.37 per gallon yesterday from its average of $1.42 last week. The figures are reported by the U.S. Department of Energy. Weekly gasoline prices can be found in Haver's WEEKLY database. Daily prices are in the DAILY database.
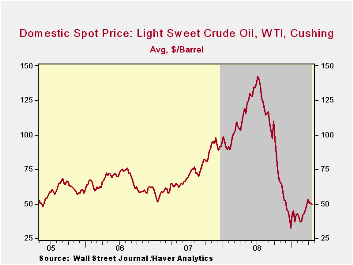
Crude oil prices weakened to an even greater degree due to soft economic news. The price for a barrel of West Texas Intermediate fell to $49.80 last week and to $45.88 yesterday. These prices remained up, however, from the December low of $32.37 per barrel. Prices reached a high of $145.66 last July. The figures on crude oil production and inventories are available in Haver's Weekly Oil Statistics database.
Higher gasoline prices and economic weakness are prompting less driving. Gasoline demand last week fell 2.4% y/y versus the 4.8% rate of decline seen last October. (Gasoline prices at the time were just off their peak.) The change in demand is measured using the latest four weeks versus the same four weeks in 2008. Demand for all petroleum products was down 5.2% y/y. That negative comparison was led by a 9.3% decline in distillate demand and a 19.7% drop in demand for residual fuel oil. These numbers are available in Haver's OILWKLY database.
The price of natural gas fell even further with the end to of winter heating season. Prices fell to $3.55 per mmbtu (-65.0% y/y) which was near the lowest level since 2002. The latest average price was down more than two-thirds from the high reached in early-July of $13.19/mmbtu.
The Economic Outlook is yesterday's speech by Fed Vice chairman Donald L. Kohn an it can be found here.
| Weekly Prices | 04/20/09 | 06/13/09 | Y/Y | 2008 | 2007 | 2006 |
|---|---|---|---|---|---|---|
| Retail Regular Gasoline ($ per Gallon, Regular) | 2.06 | 2.05 | -41.3% | 3.25 | 2.80 | 2.57 |
| Light Sweet Crude Oil, WTI ($ per bbl.) | 49.80 | 50.46 | -56.5% | 100.16 | 72.25 | 66.12 |
by Louise Curley April 21, 2009
 For the first time since
July 2007 when wind of the sub prime mortgage
crisis in the United States began to surface, there were more optimists
than pessimists among German analysts and institutional investors
regarding the outlook six months ahead. The ZEW Center for
European Economic Research at Mannheim reported today that its measure
of investor expectations (the percent balance between positive and
negative opinions) rose from -3.5% to +13%. The excess of
optimists is, however, well below the 71.0% reached in January, 2006
and also the historical average of 26.1%. It is
however, encouraging.
For the first time since
July 2007 when wind of the sub prime mortgage
crisis in the United States began to surface, there were more optimists
than pessimists among German analysts and institutional investors
regarding the outlook six months ahead. The ZEW Center for
European Economic Research at Mannheim reported today that its measure
of investor expectations (the percent balance between positive and
negative opinions) rose from -3.5% to +13%. The excess of
optimists is, however, well below the 71.0% reached in January, 2006
and also the historical average of 26.1%. It is
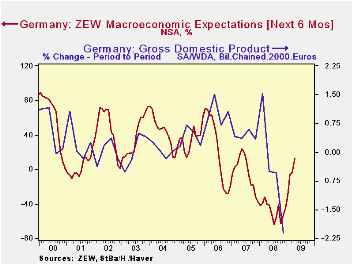
however, encouraging. 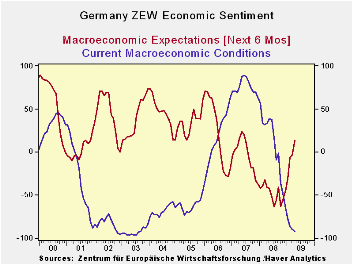 The ZEW expectation indicator has
performed reasonably well in heralding changes in German GDP and their
magnitudes, as can be seen in the first chart.
The ZEW expectation indicator has
performed reasonably well in heralding changes in German GDP and their
magnitudes, as can be seen in the first chart.
While there was an improvement in expectations among the participants in the survey, there was a worsening in their appraisal of the current conditions. The excess of pessimists over optimists rose to 91.6% from 89.4%. An excess of pessimists this large was last seen in September, 2003. The second chart shows the balances of opinion on expectations and current conditions.
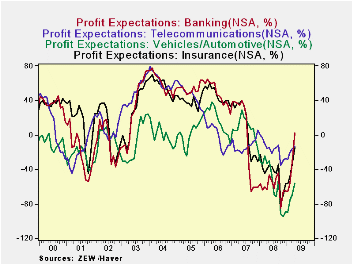 The ZEW
survey also includes the participants' expectations for profits in a
number of industries. In general the balances of opinion on
profit expectations also turned negative around August, 2007 and became
more and more negative until the last few months. Since then,
most balances of opinion have become less negative. The
exception is the expectation for profits in the banking industry where
the optimists exceed the pessimists by 2% for the first time since July
2007. The third chart shows the profit expectations for the
banking industry and a few other industries.
The ZEW
survey also includes the participants' expectations for profits in a
number of industries. In general the balances of opinion on
profit expectations also turned negative around August, 2007 and became
more and more negative until the last few months. Since then,
most balances of opinion have become less negative. The
exception is the expectation for profits in the banking industry where
the optimists exceed the pessimists by 2% for the first time since July
2007. The third chart shows the profit expectations for the
banking industry and a few other industries.
| ZEW INDICATORS (% balance) | Apr 09 | Mar 09 | Previous Low | Date | Previous High | Date |
|---|---|---|---|---|---|---|
| Expectations | 13.0 | -3.5 | -63.9 | Jul 08 | 71.0 | Jan 06 |
| Current Conditions | -91.6 | -89.4 | -91.7 | Sep 03 | 88.7 | Jun 07 |
| Profit Expectations | ||||||
| Banking | 2.0 | -31.6 | ||||
| Telecommunications | -13.0 | -16.1 | ||||
| Vehicles/Automotive | -56.1 | -70.2 | ||||
| Insurance | -15.1 | -34.2 |

Tom Moeller
AuthorMore in Author Profile »Prior to joining Haver Analytics in 2000, Mr. Moeller worked as the Economist at Chancellor Capital Management from 1985 to 1999. There, he developed comprehensive economic forecasts and interpreted economic data for equity and fixed income portfolio managers. Also at Chancellor, Mr. Moeller worked as an equity analyst and was responsible for researching and rating companies in the economically sensitive automobile and housing industries for investment in Chancellor’s equity portfolio. Prior to joining Chancellor, Mr. Moeller was an Economist at Citibank from 1979 to 1984. He also analyzed pricing behavior in the metals industry for the Council on Wage and Price Stability in Washington, D.C. In 1999, Mr. Moeller received the award for most accurate forecast from the Forecasters' Club of New York. From 1990 to 1992 he was President of the New York Association for Business Economists. Mr. Moeller earned an M.B.A. in Finance from Fordham University, where he graduated in 1987. He holds a Bachelor of Arts in Economics from George Washington University.
More Economy in Brief


