 Global| Aug 20 2007
French Industrial Orders Pop in June
Summary
French industrial orders build on May acceleration. As the Euro area growth seemed to sputter in Q2, various indicators weakened as well. And GDP in the Euro area was below expectations in Q2. Certainly the VAT hike in Germany, the [...]
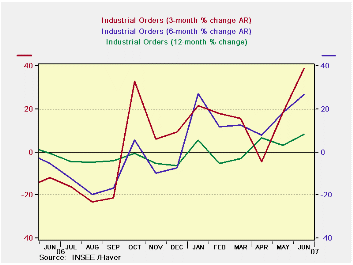
French industrial orders build on May acceleration.
As the Euro area growth seemed to sputter in Q2, various indicators weakened as well. And GDP in the Euro area was below expectations in Q2. Certainly the VAT hike in Germany, the Euro area's largest economy was a factor. But since then there have been few signs that growth has been put back on track. Against this background, strong French orders is a welcome sign. May had showed a strong bump up in orders, but the 5.1% simple monthly gain in June makes the surge in orders much more certain. With concerns about subprime lending risks and losses and other financial strife, it is key to see the economy on stronger footing. This report is the first sign we have that Europe was tipped into this period on very strong growth. It will be interesting to see what numbers will turn out for July as well. We have to wait for August figures to see true post lending crisis impacts begin to emerge.
| SAAR except m/m | Jun-07 | May-07 | Apr-07 | 3-mo | 6-mo | 12-mo |
| Total | 5.1% | 2.6% | 0.6% | 38.6% | 26.6% | 8.4% |
| Foreign | 5.1% | 4.8% | 1.7% | 57.5% | 27.7% | 8.0% |
by Louise Curley August 20 2007
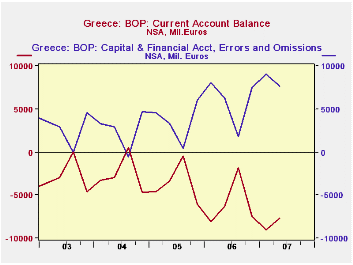
Among the Haver updates released today were balance of payments data for Greece and Taiwan. The two countries have very different balances of payments. Greece traditionally runs a deficit on current account while Taiwan runs a surplus. Typically, a deficit (surplus) is offset largely by inflows (outflows) in its capital and financial accounts and changes in foreign exchange reserves. Because of difficulties in the measurement of all the various flows in the balance of payments, an item "errors and omissions" is introduced to balance the account. The first two charts show how Greece's current account deficit, and Taiwan's surplus are offset by changes in capital flows, foreign exchange reserves and "errors and omissions".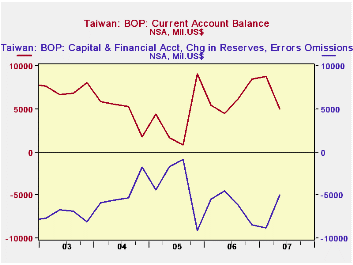
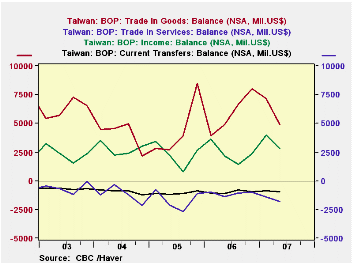
Greece's deficit on current account is the result of deficits on trade in goods and its income account that outweigh small surpluses on trade in services and transfer. Taiwan, on the other hand has a large surplus on goods and on its income account that more than offsets small deficits on trade in services and in transfers. The components of the current account for Greece and Taiwan are shown in the third and fourth charts.
When foreign exchange reserves are used to offset a deficit in the current account, they appear with a plus sign in the balance of payments account, however, the store of reserves has been reduced. Thus in the balance of payments a plus sign in the reserves means a decline in reserves and a minus sign indicates an increase. Over the years Taiwan has often opted to increase reserves, rather than invest the surplus on current account in foreign assets. At the end of June, Taiwanese reserves amounted to $266 billion, compared with $355 million for Greece. 
| Q2 07 | Q1 07 | Q2 06 | Q/Q Dif | Y/Y Dif | 2006 | 2005 | 2004 | |
|---|---|---|---|---|---|---|---|---|
| GREECE (Millions Euros) | ||||||||
| Current Account | -4688 | -9022 | -6256 | 1334 | -1432 | -23660 | -14348 | -10453 |
| Capital & Financial Account* (Includes change in Reserves |
8148 | 8800 | 6491 | 652 | 1657 | 23404 | 14655 | 10220 |
| Errors and Omission | -461 | 222 | -235 | -682 | -226 | 255 | -308 | 233 |
| Actual Foreign Exchange Reserves (Mil US$) |
355 | 466 | 514 | -101 | -159 | 389 | 326 | 679 |
| TAIWAN (Millions US$) | ||||||||
| Current Account | 4976 | 8780 | 4511 | -3804 | 465 | 24658 | 19019 | 18478 |
| Capital & Financial Account | -7187 | -10998 | -5841 | 3811 | -1346 | -19749 | 2185 | 7089 |
| Change in Foreign Exchange Reserves | 1893 | -369 | -482 | 2262 | 2375 | -6086 | -20056 | -26595 |
| Errors and Omission | 318 | 2587 | 1812 | -2269 | -1494 | 1177 | 1852 | 1028 |
| Actual Foreign Exchange Reserves (Mil US$) |
266055 | 267490 | 260350 | -1436 | 5705 | 266148 | 253290 | 241738 |
by Tom Moeller August 20, 2007
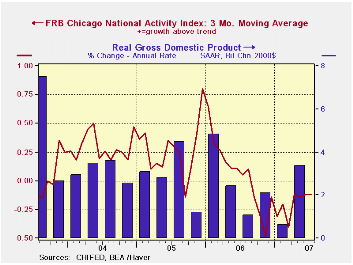
The National Activity Index (CFNAI) from the Federal Reserve Bank of Chicago fell back in July to -0.10 after a brief move into positive territory during the prior month.
The Chicago Fed indicated that the production & income category made a positive contribution to the index. They were offset by negative contributions in the employment, the consumption and housing category. The sales, orders, and inventories category made a neutral contribution in July.
The three-month moving average of the CFNAI also fell back into negative territory where it has been now for eleven months.
A zero value of the CFNAI indicates that the economy is expanding at its historical trend rate of growth and during the last twenty years there has been a 68% correlation between the level of the CFNAI and q/q growth in real GDP.
The CFNAI is a weighted average of 85 indicators of economic activity. The indicators reflect activity in the following categories: production and income, the labor market, personal consumption and housing, manufacturing and trade sales, and inventories & orders.
The complete CFNAI report is available here.
| Chicago Fed | July | June | July '06 | 2006 | 2005 | 2004 |
|---|---|---|---|---|---|---|
| CFNAI | -0.10 | 0.06 | 0.02 | 0.02 | 0.28 | 0.32 |
by U.S. Leading Economic Indicators RoseAugust 20, 2007 By Tom Moeller
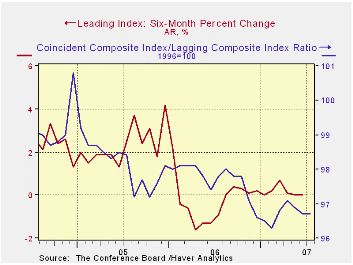
The Conference Board reported that the composite index of leading economic indicators rose 0.4% during July following an unrevised 0.3% decline during June.
During the last ten years there has been a 59% correlation between the y/y change in the leading indicators and the lagged change in real GDP.
The breadth of one month gain amongst the 10 components of the leading index improved to 65%, its best since March.
Lower initial claims for unemployment insurance and improved vendor performance accounted for most the leader’s increase.
The method of calculating the contribution to the leading index from the spread between 10 year Treasury securities and the Fed funds rate has been revised. A negative contribution will now occur only when the spread inverts rather than when declining as in the past. More details can be found here.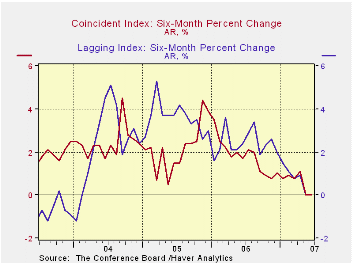
The leading index is based on eight previously reported economic data series. Two series, orders for consumer goods and orders for capital goods, are estimated.
The coincident indicators increased 0.2% after an upwardly revised 0.2% rise during June. The coincident index, made up of payroll employment, personal income, industrial production and business sales, has increased in every month since August 2005. Over the last ten years there has been a 91% correlation between the y/y change in the coincident indicators and real GDP growth.
The lagging index rose 0.2%. As a result the ratio of coincident to lagging indicators (a measure of economic excess) was unchanged. Visit the Conference Board's site for coverage of leading indicator series from around the world.
The Cost of Business Cycles for Unskilled Workers from the Federal Reserve Bank of New York can be found here.
Job-Finding and Separation Rates in the OECD from the Federal Reserve Bank of New York is available here.
| Business Cycle Indicators | July | June | Y/Y | 2006 | 2005 | 2004 |
|---|---|---|---|---|---|---|
| Leading | 0.4% | -0.3% | 0.4% | 1.2% | 2.5% | 7.1% |
| Coincident | 0.2% | 0.2% | 2.0% | 2.5% | 2.1% | 2.0% |
| Lagging | 0.2% | 0.5% | 3.2% | 3.0% | 3.5% | 0.6% |

Robert Brusca
AuthorMore in Author Profile »Robert A. Brusca is Chief Economist of Fact and Opinion Economics, a consulting firm he founded in Manhattan. He has been an economist on Wall Street for over 25 years. He has visited central banking and large institutional clients in over 30 countries in his career as an economist. Mr. Brusca was a Divisional Research Chief at the Federal Reserve Bank of NY (Chief of the International Financial markets Division), a Fed Watcher at Irving Trust and Chief Economist at Nikko Securities International. He is widely quoted and appears in various media. Mr. Brusca holds an MA and Ph.D. in economics from Michigan State University and a BA in Economics from the University of Michigan. His research pursues his strong interests in non aligned policy economics as well as international economics. FAO Economics’ research targets investors to assist them in making better investment decisions in stocks, bonds and in a variety of international assets. The company does not manage money and has no conflicts in giving economic advice.
More Economy in Brief


