 Global| Apr 28 2005
Foreign Trade Drag & Prices Up, US GDP Growth Down
by:Tom Moeller
|in:Economy in Brief
Summary
US real GDP growth of 3.1% (AR) in 1Q05 was the slowest in two years and fell short of Consensus expectations for a 3.5% advance. Also a surprise was the 3.3% rise in the GDP Chain Price Index. This strongest gain in four years easily [...]
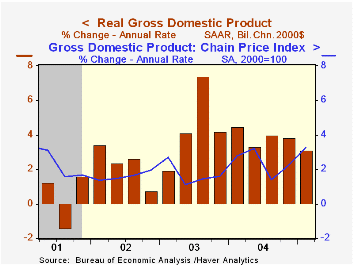
US real GDP growth of 3.1% (AR) in 1Q05 was the slowest in two years and fell short of Consensus expectations for a 3.5% advance. Also a surprise was the 3.3% rise in the GDP Chain Price Index. This strongest gain in four years easily surpassed estimates for a 2.1% increase.
The drag on US output from a deepened foreign trade deficit increased to 1.5 percentage points due to an acceleration in real import growth to 14.7% (10.8% y/y). Growth in auto imports accelerated to 13.7% (5.5% y/y) and nonauto consumer goods imports held steady at 27.8% (15.4% y/y). Capital goods imports slipped to 4.9% (14.3% y/y) and growth in exports more than doubled to 7.0% (5.9% y/y).
The acceleration in the chain price index was due to inventories and a faster 2.2% (1.6% y/y) gain in consumer prices less food & energy. In addition, after two quarters of deflation prices for business equipment & software rose 0.6% (-0.5% y/y). Overall, the price index for domestic demand held about steady at 3.0% but the y/y gain of 2.8% is up from 1.7% a year ago.
Domestic demand growth suffered mostly from slower business investment growth which fell to 4.6% (11.1% y/y) from 14.5% in 4Q. Growth in business fixed investment in computers & software picked up to an even headier 24.3% (15.7% y/y) but spending levels elsewhere fell. Consumer spending growth slipped to 3.5% (3.6% y/y). Less computers real GDP grew 2.5% (3.3% y/y) versus 4.3% growth during 2004.
Faster inventory accumulation contributed the most to output growth in a year. The 1.2% add reflected a change in real private nonfarm inventories of $82.5B which was the fastest since early 2000 and nearly double the 4Q04 rate.
A Big League Economy Tunes Up in Spring Training from the Federal Reserve Bank of Dallas is available here.
| Chained 2000$, % AR | 1Q '05 (Advance) | 4Q '04 (Final) | Y/Y | 2004 | 2003 | 2002 |
|---|---|---|---|---|---|---|
| GDP | 3.1% | 3.8% | 3.6% | 4.4% | 3.0% | 1.9% |
| Inventory Effect | 1.2% | 0.5% | 0.4% | 0.4% | -0.1% | 0.4% |
| Final Sales | 1.9% | 3.4% | 3.2% | 4.0% | 3.1% | 1.4% |
| Trade Effect | -1.5% | -1.4% | -0.8% | -0.4% | -0.3% | -0.7% |
| Domestic Final Demand | 3.2% | 4.5% | 4.0% | 4.4% | 3.4% | 2.1% |
| Chained GDP Price Index | 3.3% | 2.3% | 2.5% | 2.2% | 1.8% | 1.7% |

Tom Moeller
AuthorMore in Author Profile »Prior to joining Haver Analytics in 2000, Mr. Moeller worked as the Economist at Chancellor Capital Management from 1985 to 1999. There, he developed comprehensive economic forecasts and interpreted economic data for equity and fixed income portfolio managers. Also at Chancellor, Mr. Moeller worked as an equity analyst and was responsible for researching and rating companies in the economically sensitive automobile and housing industries for investment in Chancellor’s equity portfolio. Prior to joining Chancellor, Mr. Moeller was an Economist at Citibank from 1979 to 1984. He also analyzed pricing behavior in the metals industry for the Council on Wage and Price Stability in Washington, D.C. In 1999, Mr. Moeller received the award for most accurate forecast from the Forecasters' Club of New York. From 1990 to 1992 he was President of the New York Association for Business Economists. Mr. Moeller earned an M.B.A. in Finance from Fordham University, where he graduated in 1987. He holds a Bachelor of Arts in Economics from George Washington University.
More Economy in Brief


