Global| Feb 21 2002
Foreign Trade Deficit Improved
by:Tom Moeller
|in:Economy in Brief
Summary
The US foreign trade deficit improved unexpectedly versus a November deficit that was revised slightly deeper. Exports rose modestly, but remained down 15.2% from the peak in August 2000.Goods exports plunged 1.9% and were down 18.5% [...]

The US foreign trade deficit improved unexpectedly versus a November deficit that was revised slightly deeper.
Exports rose modestly, but remained down 15.2% from the peak in August 2000.Goods exports plunged 1.9% and were down 18.5% from their peak. Service exports rose sharply for the second consecutive month
Exports of automotive vehicles and parts fell sharply for the fifth month in six. Exports of capital goods also were down sharply, but nonauto consumer goods exports were up for the second month in three.
Imports plunged 2.9% as inventory liquidation dropped goods imports by 4.4%, down 19.0% since the peak in September 2000.
Imports of capital goods fell a sharp 2.6% and were down 27.7% from the peak last year. Also, non-auto consumer goods imports dropped 6.2% after three months of relative stability.
| Foreign Trade | Dec '01 | Nov '01 | Y/Y | 2001 | 2000 | 1999 |
|---|---|---|---|---|---|---|
| Trade Deficit | $25.3B | $28.5B | $33.3B(12/00) | $346.3B | $375.7B | $261.8B |
| Exports - Goods & Services | 0.2% | 0.3% | -12.8% | -5.8% | 11.3% | 2.6% |
| Imports - Goods & Services | -2.9% | -0.5% | -15.8% | -6.3% | 18.2% | 10.9% |
by Tom Moeller February 21, 2002
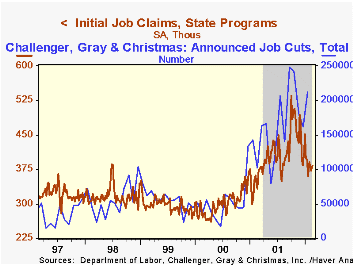
Initial claims for unemployment insurance rose slightly more than expected in the latest week. The prior week's level was not revised. It was the ninth week in eleven that claims remained below 400,000, a sign that the layoff pace remains down.
The four-week moving average of claims rose slightly to 381,750.
Continuing claims for unemployment insurance rose in the latest week. Continuing claims have risen 4.4% since early January, a sign that new hiring has not kept pace with the decline in layoffs.
The insured rate of unemployment was unchanged at 2.7%.
| Unemployment Insurance (000s) | 02/16/02 | 02/09/02 | Y/Y | 2001 | 2000 | 1999 |
|---|---|---|---|---|---|---|
| Initial Claims | 383.0 | 373.0 | 15.0% | 408.0 | 302.8 | 297.7 |
| Continuing Claims | -- | 3,501 | 48.9% | 3,031 | 2,127 | 2,187 |
by Tom Moeller February 21, 2002
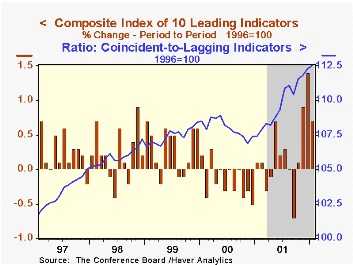
The Composite Index of Leading Economic Indicators rose about as expected last month. December's rise was revised up slightly.
The breadth of gain amongst the leaders narrowed as only about half the component series rose versus all having risen in December. Lower claims for jobless insurance and quicker vendor delivery speeds had the largest positive contribution to the leader's gain.
The ratio of coincident-to-lagging indicators, a measure of how the economy is actually performing relative to it's excesses, rose for the fourth straight month.
The Leading Index is based on eight previously reported economic data series and two that are estimated.
| Business Cycle Indicators | Jan '02 | Dec '01 | Y/Y | 2001 | 2000 | 1999 |
|---|---|---|---|---|---|---|
| Leading | 0.6% | 1.3% | 3.0% | -0.6% | 1.0% | 3.3% |
| Coincident | 0.0% | 0.1% | -0.7% | 0.3% | 3.4% | 3.2% |
| Lagging | -0.2% | -0.3% | -5.2% | -1.3% | 2.8% | 1.8% |
by Tom Moeller February 21, 2002
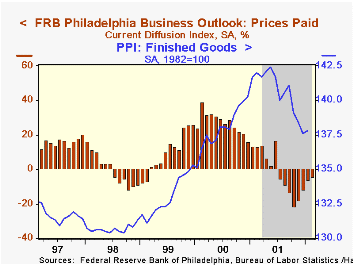
The Philadelphia Fed’s index of general business conditions improved in February rather than retracing some of last month's surge into positive territory, as expected.
New orders and shipments both added to gains in January though employment fell.
The business conditions index reflects a separate survey question, not the components.
Price deflationary pressure eased slightly for the fourth month in a row.
| Philadelphia Fed Business Outlook | Feb '02 | Jan '02 | Y/Y | 2001 | 2000 | 1999 |
|---|---|---|---|---|---|---|
| General Activity Index | 16.0 | 14.7 | -25.4 | -17.3 | 8.2 | 13.3 |
| Prices Paid Index | -4.5 | -5.9 | 12.9 | -1.0 | 27.1 | 10.0 |
by Tom Moeller February 21, 2002
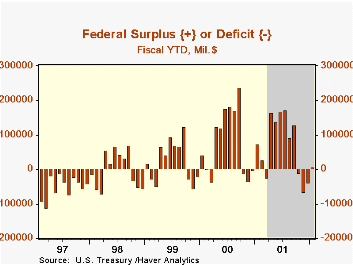
In the month of January, the Federal government recorded a $43.7B surplus versus $76.4B last year, as expected. A $6.6B surplus was logged during the first four months of fiscal 2002 which began Oct. 1. That's versus a $74.0B surplus recorded for the first four months of fiscal 2000.
Receipts rose 8.3% month-to-month. Versus last year receipts fell 7.2% pulling the fiscal year-to-date receipt total down 1.7% versus 2000. Individual income tax receipts are down 4.8% fiscal year-to-date versus 2000. Rising unemployment and lowered tax rates explain the shortfall. Corporate income tax receipts were strong as extensions on payments were granted until Jan. 15 following 9/11.
Expenditures surged fiscal year-to-date due to higher spending on defense, education and most other categories except interest.
| US Government Finance | Jan '02 | Dec '01 | Fiscal YTD | 2001 | 2000 | 1999 |
|---|---|---|---|---|---|---|
| Budget Balance | $43.7B | $26.6B | $6.6B | $127.2B | $236.9B | $124.4B |
| Revenues | 8.3% | 55.0% | -1.7% | -1.7% | 10.8% | 6.1% |
| Outlays | -1.0% | -8.1% | 9.2% | 4.2% | 5.0% | 3.1% |

Tom Moeller
AuthorMore in Author Profile »Prior to joining Haver Analytics in 2000, Mr. Moeller worked as the Economist at Chancellor Capital Management from 1985 to 1999. There, he developed comprehensive economic forecasts and interpreted economic data for equity and fixed income portfolio managers. Also at Chancellor, Mr. Moeller worked as an equity analyst and was responsible for researching and rating companies in the economically sensitive automobile and housing industries for investment in Chancellor’s equity portfolio. Prior to joining Chancellor, Mr. Moeller was an Economist at Citibank from 1979 to 1984. He also analyzed pricing behavior in the metals industry for the Council on Wage and Price Stability in Washington, D.C. In 1999, Mr. Moeller received the award for most accurate forecast from the Forecasters' Club of New York. From 1990 to 1992 he was President of the New York Association for Business Economists. Mr. Moeller earned an M.B.A. in Finance from Fordham University, where he graduated in 1987. He holds a Bachelor of Arts in Economics from George Washington University.
More Economy in Brief