 Global| Aug 07 2006
Forecast: Investment Spending on the Wane
by:Tom Moeller
|in:Economy in Brief
Summary
U.S. real GDP growth of 2.5% last quarter disappointed due to subtractions from the investment side of the ledger. A 0.1 percentage point subtraction due to lower business spending on equipment & software (-1.0% AR, +6.9% y/y) was the [...]
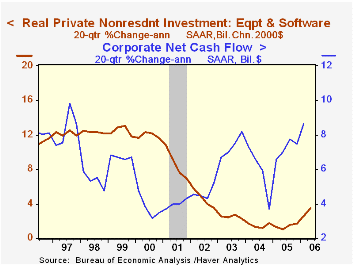
U.S. real GDP growth of 2.5% last quarter disappointed due to subtractions from the investment side of the ledger. A 0.1 percentage point subtraction due to lower business spending on equipment & software (-1.0% AR, +6.9% y/y) was the first q/q subtraction exerted since early 2003 while a 0.4 point subtraction from residential investment (-6.3% AR, -0.2% y/y) was the third in a row.
The economy's mainstay, consumer spending, also slowed somewhat to a 2.5% growth rate in 2Q from 3.4% growth during the prior four quarters, but a recent recovery in consumer sentiment, roughly 2% growth in real disposable income, and a possible end to the hikes in interest rates combine to suggest positive growth.
It's the sizzle that has been removed from the U.S. economy's growth potential. Since late 2003, business spending on equipment & software has been adding more than 0.5 percentage to GDP growth as residential investment added about the same amount.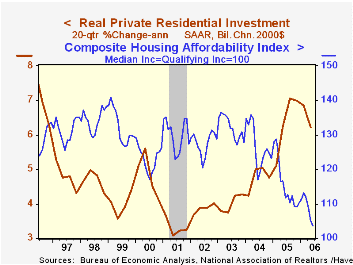
During the last five years real housing investment grew at an annual rate of 6.2%. A comparable, and even stronger, period of growth in the 1980s indeed was followed by bust. The robust expansion during the 1990s, however, was followed merely by slower growth. As for business fixed investment, it's up only an average 3.5% during the last five years. Indeed, growth during the four quarters ending in 1Q was revised lower to 7.4% from 8.9% reported in June. While improved, that growth probably was restrained by a moderate, but continuing, expansion of business' profit margins (which also were revised down). Arguing against a pending bust is that during the period, business net cash flow surged.
It's been said that forecasting is very difficult, especially when it's about the future. And now is certainly not the time to minimize the difficulties given higher oil prices, geopolitical risks and recent increases in interest rates. The current wisdom is that U.S. economic growth will continue at roughly a 3% pace next year despite somewhat slower growth in personal consumption, a halving of the growth in business investment and a further decline in housing. An improved foreign trade account is expected to be a modest offset to these diminutions. Stay tuned.
Forecasting Professional Forecasters from the Federal Reserve Board is available here.
| Chained 2000$, % AR | 2Q '06 | 1Q '06 | Y/Y | 2005 | 2004 | 2003 |
|---|---|---|---|---|---|---|
| GDP | 2.5% | 5.6% | 3.5% | 3.2% | 3.9% | 2.5% |
| Inventory Effect | 0.4% | -0.0% | 0.6% | -0.3% | 0.4% | 0.0% |
| Final Sales | 2.1% | 5.6% | 2.9% | 3.5% | 3.5% | 2.5% |
| Foreign Trade Effect | 0.3% | -0.0% | -0.1% | -0.1% | -0.5% | -0.3% |
| Domestic Final Demand | 1.6% | 5.4% | 3.0% | 3.6% | 4.0% | 2.8% |
| Chained GDP Price Index | 3.3% | 3.3% | 3.3% | 3.0% | 2.8% | 2.1% |
by Louise Curley August 7, 2006
The Japanese indexes of business conditions--the Diffusion Indexes and the Composite Indexes--are designed to facilitate the analysis of business cycles. The diffusion indexes aggregate the direction of changes of selected series to detect a business cycle phase, while the composite indexes aggregate the percentage changes of selected series to detect the volume of output as an indication of the strength or weakness of the cycle.
Both the Diffusion and the Composite indexes are classified as Leading, Coincident and Lagging. The leading indicators are generally used as predictors. They usually precede the coincident indicators by a few months. The lagging indicators are used to confirm turning points.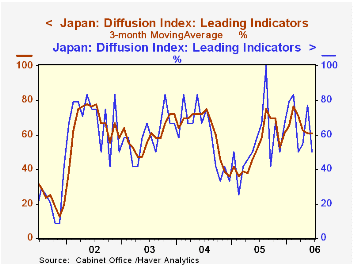
As reported, the diffusion indexes are extremely volatile. For instance, the latest report for the leading diffusion index is 50% for June, down from 77.3% in May. If we take, instead, a three month moving average, the June figures is 60.6% or the same as May. (See the first chart which shows the monthly values of the leading diffusion index and the three months moving averages.) A value of a diffusion index above 50% indicates expansion while a value below indicates a contraction. The President of the ESRI (Economic and Social Research Institute) has determined that the current cycle is dated from the trough of the last cycle--January, 2002. Thus the current expansion has been in progress for 43 months. With the leading indicator steady and the coincident and lagging diffusion indexes still showing strength, the expansion is likely to continue, for a few months, at least. The longest expansion on record is that from October, 1965 to July, 1970 a total of 57 months.
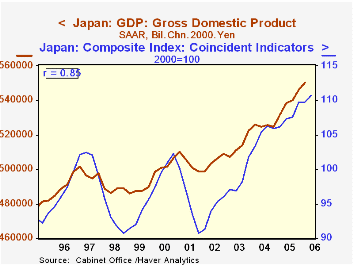
The composite leading indicator also declined in June from 108.2 (2000=100) in May to 106.2. but the three month moving average for June was 107.3, compared with 106.5 in May. The coincident composite index is also an indicator of the phase of the cycle. If it is rising (falling), the economic cycle is considered to be in the expansion (contraction) phase. In addition, the quarterly average of the composite coincident index is a good indicator of real gross domestic product as shown in the second chart. (The correlation between the two is .85.) Thus rise in the composite coincident index suggests a continued rise in real GDP for the second quarter. The first estimate of the second quarter GDP is expected on August 11.
| Japan | Jun 06 | May 06 | Jun 05 | M/M | Y/Y | 2005 | 2004 | 2003 |
|---|---|---|---|---|---|---|---|---|
| Diffusion Indexes (%) | ||||||||
| Leading Indicators | 50.0 | 77.3 | 58.3 | -27.3 | -8.3* | 55.2 | 59.4 | 59.7 |
| Coincident Indicators | 88.9 | 80.0 | 100.0 | 8.9 | -11.1* | 71.6 | 61.4 | 74.6 |
| Lagging Indicators | 75.0 | 80.0 | 83.3 | -5.0 | -8.2* | 72.2 | 77.8 | 68.8 |
| Composite Indicators (2000=100) | ||||||||
| Leading Indicators | 106.2 | 108.2 | 102.5 | -1.94 | 3.71 | 102.8 | 103.1 | 96.9 |
| Coincident Indicators | 111.2 | 110.3 | 107.6 | 0.82 | 3.35 | 107.7 | 105.2 | 98.5 |
| Lagging Indicators | 124.0 | 125.3 | 120.7 | -1.04 | 2.73 | 119.8. | 114.2 | 103.3 |

Tom Moeller
AuthorMore in Author Profile »Prior to joining Haver Analytics in 2000, Mr. Moeller worked as the Economist at Chancellor Capital Management from 1985 to 1999. There, he developed comprehensive economic forecasts and interpreted economic data for equity and fixed income portfolio managers. Also at Chancellor, Mr. Moeller worked as an equity analyst and was responsible for researching and rating companies in the economically sensitive automobile and housing industries for investment in Chancellor’s equity portfolio. Prior to joining Chancellor, Mr. Moeller was an Economist at Citibank from 1979 to 1984. He also analyzed pricing behavior in the metals industry for the Council on Wage and Price Stability in Washington, D.C. In 1999, Mr. Moeller received the award for most accurate forecast from the Forecasters' Club of New York. From 1990 to 1992 he was President of the New York Association for Business Economists. Mr. Moeller earned an M.B.A. in Finance from Fordham University, where he graduated in 1987. He holds a Bachelor of Arts in Economics from George Washington University.
More Economy in Brief


