 Global| Aug 05 2008
FOMC Left Funds Rate at 2.00% - The Balance of Factors
by:Tom Moeller
|in:Economy in Brief
Summary
As expected, the Federal Open Market Committee left the Federal funds rate unchanged today at 2.00%. The action was as widely expected. The discount rate also was left unchanged at 2.25%. The Fed's statement showed the distinct [...]
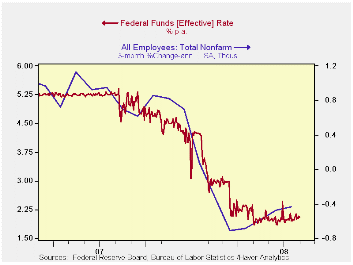
As expected, the Federal Open Market Committee left the Federal funds rate unchanged today at 2.00%. The action was as widely expected.
The discount rate also was left unchanged at 2.25%.
The Fed's statement showed the distinct balance of factors which led to the decision to leave rates unchanged.1) "Economic activity expanded in the second quarter, partly reflecting growth in consumer spending and exports. However, labor markets have softened further and financial markets remain under considerable stress."2) "Tight credit conditions, the ongoing housing contraction, and elevated energy prices are likely to weigh on economic growth over the next few quarters. Over time, the substantial easing of monetary policy, combined with ongoing measures to foster market liquidity, should help to promote moderate economic growth."3) "Inflation has been high, spurred by the earlier increases in the prices of energy and some other commodities, and some indicators of inflation expectations have been elevated. The Committee expects inflation to moderate later this year and next year, but the inflation outlook remains highly uncertain.
The decision was unanimous except that Richard W. Fisher, President of the Federal Reserve Bank of Dallas, preferred an increase in the target for the federal funds rate at this meeting.
For the complete text of the Fed's latest press release please follow this link.
Profits and Balance Sheet Developments at U.S. Commercial Banks in 2007 from the latest Federal Reserve Bulletin is available here.
| Current | Last | July | 2007 | 2006 | 2005 | |
|---|---|---|---|---|---|---|
| Federal Funds Rate, % (Target) | 2.00 | 2.00 | 2.00 | 5.05 | 4.96 | 3.19 |
| Discount Rate, % | 2.25 | 2.25 | 2.25 | 5.86 | 5.96 | 4.19 |
by Tom Moeller August 5, 2008
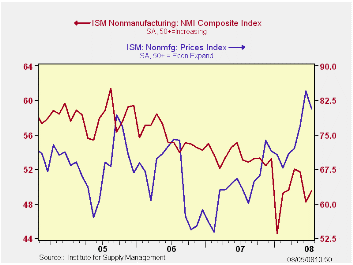
The Composite Index for the non-manufacturing sector, from the Institute for Supply Management, ticked up in July to 49.5 from an unrevised 48.2 during June. Nevertheless, the figure remained below the 2Q average of 50.6. Consensus expectations had been for a slightly lower July reading of 48.8.
Beginning with the January 2008 Non-Manufacturing Report On Business®, a composite index is now calculated as an indicator of the overall economic condition for the non-manufacturing sector. It is a composite index based on the diffusion indexes for four of the indicators (business activity, new orders, employment and supplier deliveries) with equal weights. The latest report from the ISM can be found here.
The non-manufacturing business activity sub-index fell
slightly to 49.6 from 49.9. These readings were down from 56.0 averaged
during all of last year. Since the series' inception in 1997 there has
been a 48% correlation between the level of the business activity index
for the non-manufacturing sector and the Q/Q change in real GDP for the
services and the construction sectors.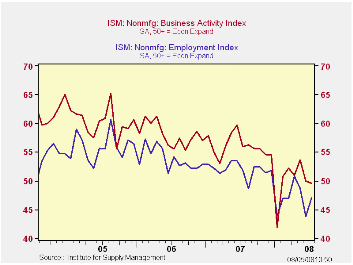
The new orders sub-index also fell to 47.9 from 48.6 during June. The latest was the lowest level since January.
The employment index bucked the trend and rose off its historic low to 47.1. Since the series' inception in 1997 there has been a 56% correlation between the level of the ISM non-manufacturing employment index and the m/m change in payroll employment in the service-producing plus the construction industries.
Pricing power eased slightly to a reading of 80.8 after the June surge. Since inception ten years ago, there has been a 60% correlation between the price index and the q/q change in the GDP services chain price index.
ISM surveys more than 370 purchasing managers in more than 62 industries including construction, law firms, hospitals, government and retailers. The non-manufacturing survey dates back to July 1997.
Economy in Low Gear Through 2008 from the Federal Reserve Bank of Chicago can be found here.
| ISM Nonmanufacturing Survey | July | June | July '07 | 2007 | 2006 | 2005 |
|---|---|---|---|---|---|---|
| Composite Index | 49.5 | 48.2 | 53.1 | 53.5 | 55.7 | 58.0 |
| Prices Index | 80.8 | 84.5 | 63.1 | 63.8 | 65.3 | 68.0 |
by Tom Moeller August 5, 2008
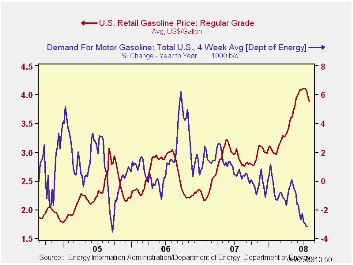
The pump price for a gallon of regular gasoline fell eight cents last week versus the prior period. At $3.88 per gallon, according to the U.S. Department of Energy survey, the price has now fallen by 23 cents, or 5.6%, from the peak just four weeks ago. Last week's price for a gallon of regular gas was the lowest since late-May. For all grades of gasoline the average price fell eight cents to $3.94 per gallon.
Yesterday the spot market price for a gallon of regular gasoline rose four cents, from Friday, to $3.06 per gallon. That was versus last week's average of $3.00. It still was down from the high two weeks ago above $3.40.
Weekly gasoline prices can be found in Haver's WEEKLY database, daily prices are in the DAILY database.
According to the U.S. Department of Energy, though the demand
for gasoline was unchanged last week from the prior period, gasoline
demand during the latest four weeks fell 3.2% from a year earlier. That
y/y decline nearly equaled the decline in gasoline demand three years
ago when Hurricane Katrina struck and it limited gasoline supplies.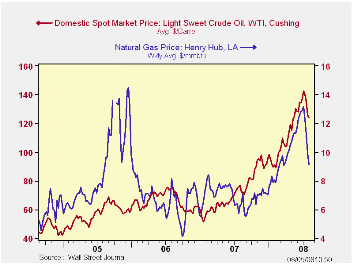
The DOE figures are available in Haver's OILWKLY database.
The price for a barrel of West Texas Intermediate crude oil fell last week to an average $124.21 per barrel.
Prices for natural gas fell further w/w to an average $9.16 per mmbtu (+45.8% y/y).
Unanchored Expectations? Interpreting the Evidence from Inflation Surveys from the Federal Reserve Bank of San Francisco can be found here.
| Weekly Prices | 08/04/08 | 07/28/08 | Y/Y | 2007 | 2006 | 2005 |
|---|---|---|---|---|---|---|
| Retail Regular Gasoline ($ per Gallon) | 3.88 | 3.96 | 36.7% | 2.80 | 2.57 | 2.27 |
| Light Sweet Crude Oil, WTI ($ per bbl.) | 124.21 | 126.14 | 63.3% | 72.25 | 66.12 | 56.60 |
by Tom Moeller August 5, 2008
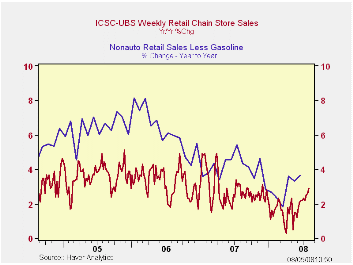
Chain store sales, according to the International Council of Shopping Centers, held onto the strong gain during the prior week. The unchanged level of sales in early-August followed a 1.2% w/w jump at the end of July. It left the level of sales at its record high which was up 1.0% from the July average. That followed July's 0.4% rise.
During the last ten years there has been a 45% correlation between the y/y change in chain store sales and the change in nonauto retail sales less gasoline.The ICSC-UBS retail chain-store sales index is constructed using the same-store sales (stores open for one year) reported by 78 stores of seven retailers: Dayton Hudson, Federated, Kmart, May, J.C. Penney, Sears and Wal-Mart.
The leading indicator of chain store sales from ICSC-UBS continued to weaken and fell 1.5% (-5.3% y/y) after a 0.9% decline during the week prior.
The chain store sales figures are available in Haver's SURVEYW database.
Can Young Americans Compete in a Global Economy? from the Federal Reserve Bank of San Francisco is available here.
| ICSC-UBS (SA, 1977=100) | 08/08/08 | 07/26/08 | Y/Y | 2007 | 2006 | 2005 |
|---|---|---|---|---|---|---|
| Total Weekly Chain Store Sales | 499.2 | 499.2 | 2.9% | 2.8% | 3.3% | 3.6% |
by Robert Brusca August 5, 2008
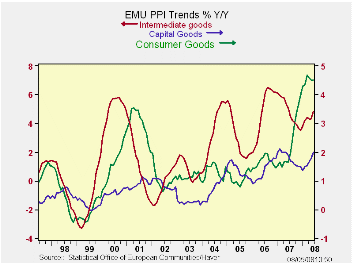
Central banks are not having good luck with inflation. Of
course, critics will say that inflation fighting has little to do with
luck and that is true enough. The PPI is not a targeted rate by the ECB
so in some sense it can be anything and it doesn’t matter. But we know
it matters and that PPI prices feed into sectors and become costs for
consumer prices so a surging PPI is not good news at all.
| Euro Area and UK PPI Trends | ||||||
|---|---|---|---|---|---|---|
| M/M | Saar | |||||
| Euro Area -13 | Jun-08 | May-08 | 3-Mo | 6-Mo | Yr/Yr | Y/Y Yr Ago |
| Total excl Constructions | 0.9% | 1.2% | 12.8% | 11.1% | 8.0% | 2.3% |
| Excl Energy | 0.4% | 0.3% | 4.4% | 5.5% | 4.0% | 3.1% |
| Capital Goods | 0.2% | 0.2% | 2.5% | 3.0% | 2.0% | 1.9% |
| Consumer Goods | 0.2% | 0.1% | 2.1% | 3.6% | 4.5% | 1.6% |
| Intermediate & Capital Goods | 0.4% | 0.4% | 5.6% | 6.5% | 3.8% | 3.9% |
| Energy | 2.7% | 4.1% | 41.9% | 29.9% | 21.4% | -0.5% |
| MFG | 0.7% | 1.3% | 11.0% | 9.5% | 6.9% | 2.6% |
| Germany | 0.9% | 1.0% | 12.5% | 10.9% | 6.7% | 1.7% |
| Excl Energy | 0.3% | 0.4% | 3.9% | 4.5% | 3.0% | 2.8% |
| France | 0.7% | 1.3% | 11.7% | 9.2% | 7.3% | 1.9% |
| Excl Energy | 0.4% | 0.3% | 3.9% | 4.7% | 3.8% | 2.6% |
| Italy | 0.8% | 1.5% | 11.1% | 10.8% | 8.2% | 2.7% |
| Excl Energy | 0.5% | 0.2% | 5.1% | 6.4% | 4.2% | 3.2% |
| UK | 2.0% | 2.6% | 32.2% | 22.0% | 19.5% | 1.2% |
| Excl Energy | 0.8% | 1.4% | 12.9% | 11.3% | 7.2% | 2.9% |
| Euro Area 13 Harmonized PPI excluding Construction | ||||||
| The EA 13 countries are Austria, Belgium, Finland, France, Germany, Greece, Ireland, Italy, Luxembourg, the Netherlands, Portugal, Slovenia | ||||||
by Louise Curley August 5, 2008
The indexes of retail trade in the Euro Area and the European
Union, exclude the sales of motor vehicles and motor cycles. There are
two indexes of total retail sales: one includes repairs of personal and
household repairs and the other excludes them. The most quoted index
excludes the repairs.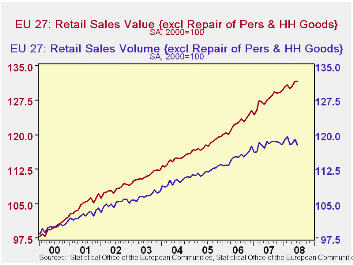
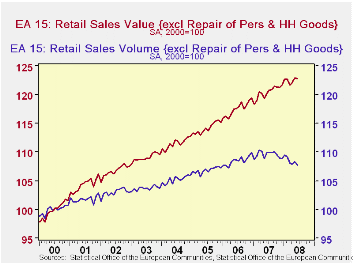
The index of value of retail trade, excluding repairs, in the Euro Area declined by a mere 0.06% in June from May, but the volume declined by 0.6%. Although the value of retail sales increased 1.4% from June of 2007 to June of 2008, the volume declined by 3.1%. Over this period, sales of food declined by 4.4% and sales of non food items, by 2.2%.The value and volume of retail trade in the Euro Area are shown in the first chart.
As some of the Non Euro Area countries in the European Union, particularly those in eastern Europe, chalked up substantial year over year increases in the volume of retail trade, the decline in the volume of sales over the last year was less than that for the European Union-- -1.1% vs.-3.1%. Among these, Romania showed a whopping 23.3% increase in the volume of retail sales, while Slovenia, Poland and the Czech Republic showed more moderate increases of 5.7%, 5.2% and 5.1%, respectively. The value of retail trade in the entire European Union was unchanged from May to June while the volume was down 1.1%. The value and volume of retail trade in the European Union are shown in the second chart.
| EURO AREA (15) EU (27) (2000=100) | Jun 08 | May 08 | Jun 07 | M/M % chg |
Y/Y % chg |
2007 | 2006 | 2005 |
|---|---|---|---|---|---|---|---|---|
| EURO AREA | ||||||||
| Volume of Retail Sales ex Repairs (NSA) | 104.9 | 106.7 | 108.24 | -- | -3.1 | 109.5 | 108.5 | 106.8 |
| Volume of Retail Sales ex Repairs (SA) | 107.8 | 108.4 | 109.9 | -0.6 | -- | 109.5 | 108.5 | 106.8 |
| Value of Retail Sales ex Repairs (NSA) | 120.7 | 121.9 | 119.1 | -- | 1.4 | 120.4 | 117.5 | 114.2 |
| Value of Retail Sales ex Repairs (NSA) | 122.8 | 122.9 | 120.3 | -0.06 | -- | 120.4 | 117.5 | 114.2 |
| EUROPEAN UNION | ||||||||
| Volume of Retail Sales ex Repairs (NSA) | 115.1 | 116.9 | 116.3 | -- | -1.1 | 117.9 | 115.2 | 112.2 |
| Volume of Retail Sales ex Repairs (SA) | 117.8 | 119.1 | 118.6 | -1.0 | -- | 117.9 | 115.2 | 112.2 |
| Value of Retail Sales ex Repairs (NSA) | 129.4 | 130.4 | 126.3 | -- | -0.74 | 127.8 | 122.4 | 118.0 |
| Value of Retail Sales ex Repairs (NSA) | 131.6 | 131.6 | 127.6 | 0.0 | -- | 127.8 | 122.4 | 118.0 |

Tom Moeller
AuthorMore in Author Profile »Prior to joining Haver Analytics in 2000, Mr. Moeller worked as the Economist at Chancellor Capital Management from 1985 to 1999. There, he developed comprehensive economic forecasts and interpreted economic data for equity and fixed income portfolio managers. Also at Chancellor, Mr. Moeller worked as an equity analyst and was responsible for researching and rating companies in the economically sensitive automobile and housing industries for investment in Chancellor’s equity portfolio. Prior to joining Chancellor, Mr. Moeller was an Economist at Citibank from 1979 to 1984. He also analyzed pricing behavior in the metals industry for the Council on Wage and Price Stability in Washington, D.C. In 1999, Mr. Moeller received the award for most accurate forecast from the Forecasters' Club of New York. From 1990 to 1992 he was President of the New York Association for Business Economists. Mr. Moeller earned an M.B.A. in Finance from Fordham University, where he graduated in 1987. He holds a Bachelor of Arts in Economics from George Washington University.
More Economy in Brief


