 Global| Dec 16 2008
FOMC Cut Funds Rate to Near 0%
by:Tom Moeller
|in:Economy in Brief
Summary
The Federal Open Market Committee today cut the Federal funds rate more than expected to a "range from 0 to 1/4 percent." The discount also was cut to 0.50%. The latest Fed funds rate was its lowest ever. While the latest action was a [...]
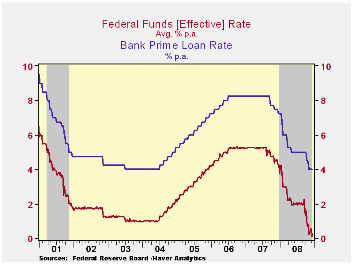
The Federal Open Market Committee today cut the Federal funds rate more than expected to a "range from 0 to 1/4 percent." The discount also was cut to 0.50%. The latest Fed funds rate was its lowest ever. While the latest action was a greater cut than generally anticipated by economists, it had been mostly discounted by markets. During December the effective Fed funds rate traded between 0.15% and 0.52%.
Regarding economic growth, the Fed indicated that "Since the
Committee's last meeting, labor market conditions have deteriorated,
and the available data indicate that consumer spending, business
investment, and industrial production have declined. Financial markets
remain quite strained and credit conditions tight. Overall, the outlook
for economic activity has weakened further."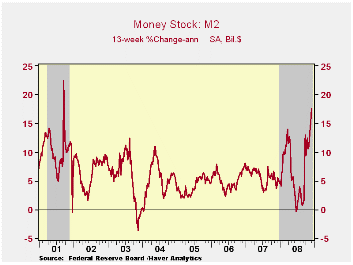
Regarding inflation it was indicated that "inflationary pressures have diminished appreciably. In light of the declines in the prices of energy and other commodities and the weaker prospects for economic activity, the Committee expects inflation to moderate further in coming quarters."
Moreover, the Fed highlighted its concern about the recent turmoil in the credit markets. "The focus of the Committee's policy going forward will be to support the functioning of financial markets and stimulate the economy through open market operations and other measures that sustain the size of the Federal Reserve's balance sheet at a high level ... The Federal Reserve will continue to consider ways of using its balance sheet to further support credit markets and economic activity."
The decision was unanimous amongst FOMC voters.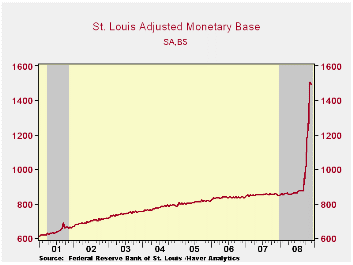
For the complete text of the Fed's latest press release please follow this link.
In addition to lowering the cost of credit in the effort to prompt economic growth, the Fed indeed has worked to promote faster growth in financial liquidity. Growth in the money stock measure M2 rose to 17.6% over the last three months, up from a 5% growth rate earlier this year. Growth in demand deposits alone jumped to 40% y/y. Direct injection of liquidity to the financial system is evident in the monetary base which is up by three-quarters versus last year. Also promoting U.S. economic growth these liquidity injections have started to impact the foreign exchange value of the U.S. dollar which is down 6% from its mid-November peak.
The Financial Crisis and the Policy Responses: An Empirical Analysis of What Went Wrong is a new paper by John B. Taylor, Professor of Economics, Stanford University and Senior Fellow, Hoover Institution. It is available here.
Globalization and the Changing Nature of the U.S. Economy’s Influence in the World from the Federal Reserve Bank of Dallas can be found here.
| Current | Last | September | 2007 | 2006 | 2005 | |
|---|---|---|---|---|---|---|
| Federal Funds Rate, % (Target) | 0.00 - 0.25 | 1.00 | 2.00 | 5.05 | 4.96 | 3.19 |
| Discount Rate, % | 0.50 | 1.25 | 2.25 | 5.86 | 5.96 | 4.19 |
by Tom Moeller December 16, 2008
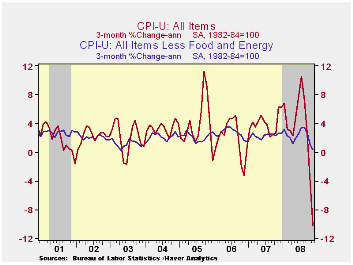
The consumer price index (CPI-U) fell by a record 1.7% during November versus October, according to the Bureau of Labor Statistics. Indeed, the decline was the greatest in the series' history which dates back to 1947. The latest fall nearly doubled the October drop of 1.0% and it compared to Consensus expectations for a 1.3% decline. The latest reading lowered the three-month rate of change to -10.2% (AR).
There has been an about-face in fuels' prices since earlier this year and lower energy prices account for most of the recent decline in the total CPI. After rising sharply through July, they've fallen each month by a total of 27.9%. In November alone, energy prices fell 17.0% from October and the drop was led by a record 29.5% fall in gasoline prices (-29.5% y/y) to an average of $2.15 per gallon. Gas prices have moved even lower this month to $1.66. Fuel oil prices fell 13.6% (-3.4% y/y) for the fourth consecutive monthly drop and prices for natural gas & electricity fell 1.0% m/m (+8.1% y/y).
Last month, food & beverage prices continued to buck that downtrend with a 0.2% increase. Perhaps the good news is that the gain was the weakest since February and the running 3-month rate of increase fell to 4.1%, down from a high of 9.1% this past August. Nevertheless, the three-month rate of increase in prices of cereals & bakery products was 7.8% versus a recent high of 19.5% and prices of meats, poultry & fish rose at a 3.5% rate versus the high of 10.9%.
Recent weakness in consumer prices has been reinforced by a
decline in core pricing power. The CPI less food &
energy was unchanged last month versus Consensus expectations
for a 0.1% uptick. The three-month annual rate of increase fell to 1.1%
from its July high of 3.5%.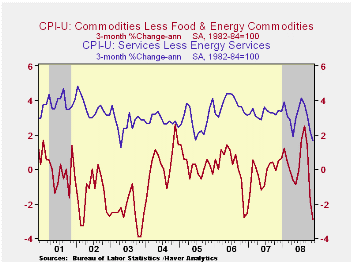
Core goods prices, down 0.2%, fell for the third straight month and the three-month rate of decline amounted to 2.9% which was the weakest since late-2003. The latest decline was led again by lower prices for new & used motor vehicles which were down another 0.9% (-3.1% y/y). Apparel prices ticked up 0.3% (0.0% y/y) after their sharp 1.0% October decline. Prices for household furnishings & operations reflected the weakness in the housing sector and fell 0.2% (+1.8% y/y). Tobacco prices were unchanged for the second month in the last three but they still rose 6.7% y/y.
Core services prices ticked up 0.1%. The three-month growth rate of 2.1% matched the lowest since 2005 which was the least since 2001. Medical care services prices rose just 0.1% (3.1% y/y) but education costs remained firm. They increased 0.4% for the third straight month (5.7% y/y). Shelter prices rose 0.2% (2.1% y/y). As the housing market remained deeply depressed the y/y increase was miniscule. Owners equivalent rent of primary residence, a measure not equivalent to other house price measures, rose 0.3% (2.3% y/y) while rents rose 0.3% (3.6% y/y). Public transportation prices fell for the third consecutive month and the 4.1% year-to-year rate of increase was down from 15.2% this past August. Recreation prices were unchanged (2.0% y/y).
The chained CPI, which adjusts for shifts in consumption patterns, fell 2.0%. Less food and energy, chained prices fell 0.3%.
| Consumer Price Index (%) | November | October | Y/Y | 2007 | 2006 | 2005 |
|---|---|---|---|---|---|---|
| Total | -1.7 | -1.0 | 1.0 | 2.9 | 3.2 | 3.4 |
| Total less Food & Energy | 0.0 | -0.1 | 2.0 | 2.3 | 2.5 | 2.2 |
| Goods less Food & Energy | -0.2 | -0.4 | -0.2 | -0.4 | 0.2 | 0.5 |
| Services less Energy | 0.1 | 0.0 | 2.9 | 3.4 | 3.4 | 2.8 |
| Energy | -17.0 | -8.6 | -13.4 | 5.6 | 11.0 | 17.0 |
| Food & Beverages | 0.2 | 0.3 | 5.9 | 3.9 | 2.3 | 2.5 |
| Chained CPI: Total (NSA) | -2.0 | -0.8 | 0.7 | 2.5 | 2.9 | 2.9 |
| Total less Food & Energy | -0.3 | 0.1 | 1.6 | 2.0 | 2.2 | 1.9 |
by Tom Moeller December 16, 2008
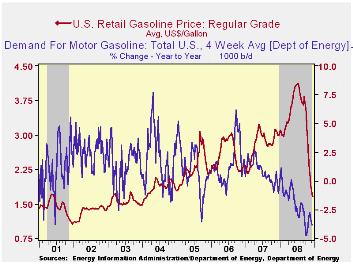
Regular gasoline prices continued lower, according to the U.S. Department of Energy survey. The latest price of $1.66 per gallon was down four cents per gallon from the prior week and was down from $4.11 per gallon early this past July. The latest decline was accompanied by a drop in the average price for all grades of gasoline to $1.72 per gallon.
Yesterday, the spot market price for a gallon of regular gasoline was up slightly from last week at $1.01 per gallon.
Weekly gasoline prices can be found in Haver's WEEKLY
database. Daily prices are in the DAILY
database.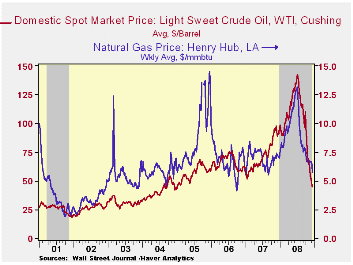
Though gasoline prices are down, that has done little to drive up product demand. The U.S. Department of Energy reported that the demand for gasoline fell by 3.9% y/y, nearly the fastest since late-1995 (the latest four weeks versus the same four weeks last year). The demand for all petroleum products also fell 6.1% y/y.
These DOE figures are available in Haver's OILWKLY database.
The price for a barrel of West Texas Intermediate crude oil fell last week by roughly one dollar from the prior week's average to $44.71 per barrel, down by two-thirds since the peak in July of $145.66. In futures trading yesterday, the one-month price for crude oil was $44.51.
Last week, prices for natural gas moved even lower to $5.70 per mmbtu (-20.4% y/y). The latest average price was 50% below natural gas prices in early-July of $13.19/mmbtu.
| Weekly Prices | 12/15/08 | 12/08/08 | Y/Y | 2007 | 2006 | 2005 |
|---|---|---|---|---|---|---|
| Retail Regular Gasoline ($ per Gallon) | 1.66 | 1.70 | -44.7% | 2.80 | 2.57 | 2.27 |
| Light Sweet Crude Oil, WTI ($ per bbl.) | 44.71 | 45.50 | -51.0% | 72.25 | 66.12 | 56.60 |
by Tom Moeller December 16, 2008
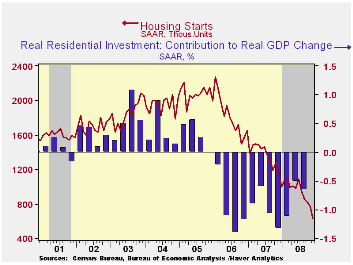
Housing starts fell even further last month. The level of 625,000 units (SAAR) was the lowest in the series' history which dates back to 1959. It followed a downwardly revised October figure of 771,000. Consensus expectations had been for November starts of 735,000.
Perhaps more indicative of the bleeding in the housing sector was that the speed of the decline in starts during the last three months accelerated to a 71.3% annual rate. That is nearly double the rates of earlier this year and it is nearly triple the rate of 2007.
Starts of single-family homes fell a whopping 16.9% m/m to
441,000 from an unrevised October level. The latest level also was a
record low and it is down by three-quarters since the peak in early
2006. The latest was the lowest level since the 1981-82 recession. During
the last three months, the rate of decline picked up to -73.6%, also
twice as fast as earlier in 2008 and triple 2007. Permits
to build single-family homes also were quite weak and fell by roughly
the same 12.3% (-46.3% y/y) as during October.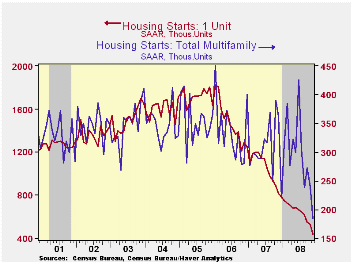
During 4Q starts are down 19.4% from the 3Q average and in the last ten years there has been an 84% correlation between the q/q change in single-family starts and their contribution to quarterly GDP growth.
October multi-family starts fell 26.3% from October and they are down by one-half from last year.
By region, November starts of single-family units in the Northeast fell 42.1% m/m and by 59.8% y/y. In the Midwest, starts fell 12.9% (-41.7% y/y) and in the South single-family starts fell 13.6% (-45.7% y/y). Finally, starts in the West starts fell 15.5% (-43.4% y/y).
| Housing Starts (000s, SAAR) | November | October | September | Y/Y | 2007 | 2006 | 2005 |
|---|---|---|---|---|---|---|---|
| Total | 625 | 771 | 824 | -47.0% | 1,341 | 1,812 | 2,073 |
| Single-Family | 441 | 531 | 551 | -46.0 | 1,034 | 1,474 | 1,719 |
| Multi-Family | 184 | 240 | 273 | -49.3 | 307 | 338 | 354 |
| Building Permits | 616 | 730 | 805 | -48.1 | 1,389 | 1,844 | 2,160 |
by Louise Curley December 16, 2008
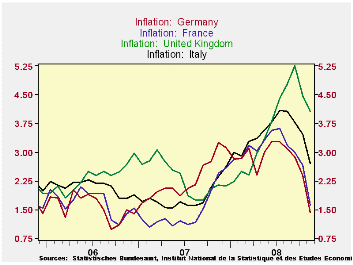
More countries are reporting declining rates of inflation.
Recently published inflation rates in the four largest countries of
Europe--Germany, France, Italy and the United Kingdom--continue to
trend downward, as can be seen in the first chart. In November, the
inflation rate in Germany was 1.43%, down 1.85 percentage points from
its peak of 3.28% in June. The rate in France was 1.63%, down 1.98
percentage points from its peak of 3.61% in July. And in Italy, the
rate was 2.70%, down 1.38 percentage points from its peak of 4.08% in
July.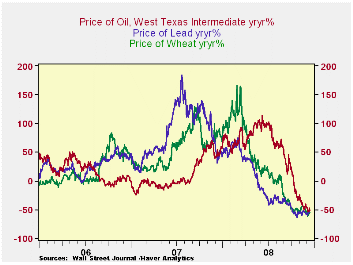
Although the rate in the U.K. in November was still high at 4.07%, it was 1.18 percentage points below its recent peak of 5.25% in September. Moreover, Mervyn King, Governor of the Bank of England, in a letter to the Chancellor of the Exchequer (The governor is required to write an explanation to the Chancellor of the Exchequer whenever the inflation rate exceeds 3%) expressed his view that the rate of inflation in the U. K. could fall below 1% in the next year.
The world wide economic slowdown is responsible for much of the decline in inflation and, in turn, of the much deeper decline in commodity prices. When demand changes significantly, basic commodity prices tend to rise or fall to a much greater degree. The volatility of the changes in the prices of oil, lead and wheat as typical of commodity prices are shown in the second chart. The prices of all three commodities are currently about 50% below prices of a year ago.
| INFLATION RATES (%) | Nov 08 | Oct 08 | Peak | Date 08 | Chg from Peak | 2007 | 2006 | 2005 |
|---|---|---|---|---|---|---|---|---|
| Italy | 2.70 | 3.46 | 4.08 | July | -1.38 | 1.83 | 2.09 | 1.99 |
| United Kingdom | 4.07 | 4.16 | 5.25 | Sep | -1.18 | 2.32 | 2.33 | 2.05 |
| France | 1.63 | 2.67 | 3.61 | July | -1.98 | 1.44 | 1.68 | 1.74 |
| Germany | 1.43 | 2.39 | 3.28 | June | -1.85 | 2.29 | 1.57 | 1.56 |
by Robert Brusca December 16, 2008
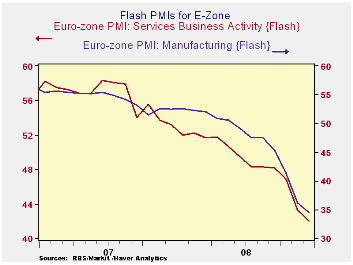
The Markit PMI FLASH indices for the MFG and Services sectors
show that deterioration continues. Both are on lows for the period that
the services index has been available.
The drop this month was much smaller than last month’s drop.
Still the result tells us that month-to-month conditions that already
are weak are getting worse. That’s a bad sign. Still the ECB’s Trichet
says the decision for the next meeting is no foregone conclusion. How
bad are things?
The manufacturing index began in June 1997, the Services
series began in July 1998. Both are on all time lows for their
respective periods.
The EMU indices are available for a shorter period than the US
measure at least for MFG. And since the US MFG measure is already
extremely low in its longer term range we might surmise that the level
of distress indicated by this shorter lived EMU index is in fact
comparable to some of the extremely weak periods of its past using its
tracking with the US index as a reason for the conclusion. Already many
EMU measure are extremely weak. The US MFG PMI that goes back to 1950
finds the current (Nov) US index is weaker only 1.6% of the time. Is
Europe that bad off too? If so is this anyplace for the ECB to halt
cutting rates? Just a thought.
| FLASH Readings | ||
|---|---|---|
| Markit PMIs for the E-Zone-13 | ||
| MFG | Services | |
| Dec-08 | 34.47 | 42.05 |
| Nov-08 | 35.58 | 42.47 |
| Oct-08 | 41.10 | 45.76 |
| Sep-08 | 44.97 | 48.44 |
| Averages | ||
| 3-Mo | 40.55 | 44.10 |
| 6-Mo | 44.29 | 46.16 |
| 12-Mo | 48.07 | 48.73 |
| 125-Mo Range | ||
| High | 60.47 | 62.36 |
| Low | 34.47 | 42.05 |
| % Range | 0.0% | 0.0% |

Tom Moeller
AuthorMore in Author Profile »Prior to joining Haver Analytics in 2000, Mr. Moeller worked as the Economist at Chancellor Capital Management from 1985 to 1999. There, he developed comprehensive economic forecasts and interpreted economic data for equity and fixed income portfolio managers. Also at Chancellor, Mr. Moeller worked as an equity analyst and was responsible for researching and rating companies in the economically sensitive automobile and housing industries for investment in Chancellor’s equity portfolio. Prior to joining Chancellor, Mr. Moeller was an Economist at Citibank from 1979 to 1984. He also analyzed pricing behavior in the metals industry for the Council on Wage and Price Stability in Washington, D.C. In 1999, Mr. Moeller received the award for most accurate forecast from the Forecasters' Club of New York. From 1990 to 1992 he was President of the New York Association for Business Economists. Mr. Moeller earned an M.B.A. in Finance from Fordham University, where he graduated in 1987. He holds a Bachelor of Arts in Economics from George Washington University.
More Economy in Brief


