 Global| Oct 08 2008
FOMC at Emergency Meeting Cut Funds Rate to 1.5%; Other Signs of Monetary Ease
by:Tom Moeller
|in:Economy in Brief
Summary
At an emergency meeting, the U.S. Federal Open Market Committee lowered the federal funds rate by 50 basis points to 1.5%. The move was an action coordinated with the Central Banks of Europe and Japan. The Fed indicated that "the move [...]
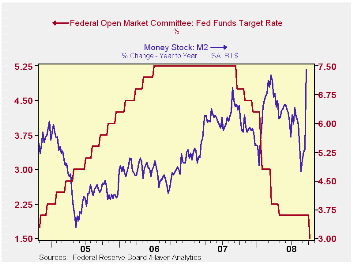
At an emergency meeting, the U.S. Federal Open Market Committee lowered the federal funds rate by 50 basis points to 1.5%. The move was an action coordinated with the Central Banks of Europe and Japan. The Fed indicated that "the move was necessary because of the worsening crisis in global financial markets."
The decision was unanimous amongst FOMC members.
The action by the Fed brought the funds rate to its lowest level since mid-2004. The discount rate was also lowered by 50 basis points to 1.75%.
For the complete text of the Fed's latest press release please follow this link.
In another other sign of monetary easing, the Fed took steps this week that could make trillions of dollars available by lending directly to nonfinancial corporations.
The other tool which the Fed is using to inject liquidity into the market is reflected by the monetary aggregates. Growth in the monetary base has accelerated to 10.9% from 2.0%. M1 growth has risen to 8.3% from 2.3%; M2 growth rose to 7.4% from 5.6%.
Liquidity Crisis from the Federal Reserve Bank of Philadelphia can be found here.
| Current | Last | September '07 | 2007 | 2006 | 2005 | |
|---|---|---|---|---|---|---|
| Federal Funds Rate, % (Target) | 1.50 | 2.00 | 4.94 | 5.02 | 4.96 | 3.19 |
| Discount Rate, % | 1.75 | 2.25 | 5.53 | 5.86 | 5.95 | 4.18 |
by Robert Brusca October 8, 2008
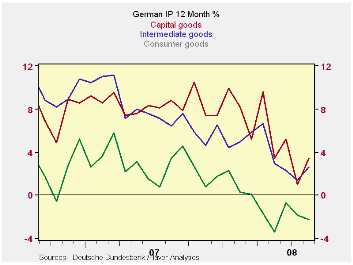
German New Orders and retail sales rose unexpectedly in
August. So the August rise in IP of 3.4% is less of a surprise than it
other wise would be. There is a growing consensus that the timing of
holidays has had a lot to do with the false strength being recorded in
August. It is hard to find anyone who wants to take these signs of
strength to heart.
Still IP trends do not yet look as weak as the dwindling
(pre-August) trends in orders and in retailing (see the current orders
trends in the table above). At 1.7% 12-month IP growth is firm. Over
six months IP is off by 0.6%. But over three months it is up at a
whopping 7.7% pace. Still, quarter-to-date IP is off at a 2.2% annual
rate.
The patterns in IP also mark most of the major categories. A
minor exception is for quarter-to-date growth. There, the negative
growth in the quarter is all due to severe weakness in capital goods
output. Consumer goods and intermediate goods output each still are
advancing in the quarter but at a near crawl, a 0.5% annual rate for
both.
| Total German IP | |||||||
|---|---|---|---|---|---|---|---|
| Saar except m/m | Aug-08 | Jul-08 | Jun-08 | 3-mo | 6-mo | 12-mo | Quarter-to-Date |
| IP total | 3.4% | -1.6% | 0.2% | 7.7% | -0.5% | 1.7% | -2.2% |
| Consumer Goods | 3.0% | -1.6% | 0.5% | 7.7% | -1.2% | -2.3% | 0.5% |
| Capital Goods | 3.9% | -3.1% | 1.7% | 9.7% | -1.0% | 3.4% | -6.4% |
| Intermediary Goods | 2.6% | -0.6% | -0.5% | 6.4% | 1.6% | 2.6% | 0.4% |
| Memo | |||||||
| Construction | 5.5% | -2.6% | -2.4% | 1.0% | -19.2% | 0.5% | -3.8% |
| MFG IP | 3.2% | -1.8% | 0.6% | 8.0% | 0.0% | 2.0% | -2.4% |
| MFG Orders | 3.6% | -1.3% | -2.6% | -1.2% | -7.3% | -1.3% | -7.7% |
by Tom Moeller October 8, 2008
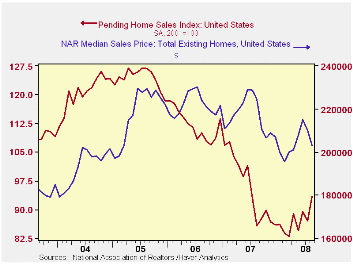
The National Association of Realtors reported that during August pending sales of existing homes rose 7.4% and reversed the July decline of 2.7% which was revised slightly shallower from the initial report. The August rise compared to Consensus expectations for a 1.1% drop.
The level of sales during August was the highest since June of last year. The level also was 12.5% above the low hit this past March.
These figures are analogous to the new home sales data from the Commerce Department in that they measure existing home sales when the sales contract is signed, not at the time the sale is closed. The series dates back to 2001.
By region, a recovery in sales in the West led last month's increase with an 18.4% m/m gain bringing the level to the highest since early 2006. Sales in the Northeast also firmed and they rose 8.4%, a gain which recovered all of the prior month's drop. Sales in the Midwest rose 3.6% and they are up 14.0% from the March low. In the South sales rose 2.3%. They rose 13.2% from the March low.
The Realtors Association indicated in an earlier report that the number of homes on the market and available for sale fell a not seasonally adjusted 7.0% (-2.9% y/y). That was the first y/y decline since early 2005.
At the current sales rate there was a 10.4 months' supply of homes on the market versus an 8.9 months' average during all of last year, a 6.5 months' supply in 2006 and a 4.5 months' supply in 2005. The latest level was the lowest, however, since this past March. For single family homes the months' supply fell to 10.0, also the lowest since March but still well above the 8.7 average of last year.
The median sales price of an existing single family home fell 3.4% (-9.5% y/y) during August. Prices were down 11.3% from their peak during June of last year. For single family homes prices fell 3.4% (-9.7% y/y) and they were off 11.9% from last year's June peak.
The pending home sales data are available in Haver's PREALTOR database and the number of homes on the market and prices are in the REALTOR database.
| Pending Home Sales (2001=100) | August | July | Y/Y | 2007 | 2006 | 2005 |
|---|---|---|---|---|---|---|
| Total | 93.4 | 87.0 | 8.9% | 95.7 | 112.1 | 124.3 |
| Northeast | 79.8 | 73.6 | 2.0 | 85.6 | 98.5 | 108.3 |
| Midwest | 84.5 | 81.6 | 6.6 | 89.6 | 102.0 | 116.4 |
| South | 96.0 | 93.8 | -2.0 | 107.3 | 127.3 | 134.8 |
| West | 109.5 | 92.5 | 37.9 | 92.1 | 109.5 | 128.6 |

Tom Moeller
AuthorMore in Author Profile »Prior to joining Haver Analytics in 2000, Mr. Moeller worked as the Economist at Chancellor Capital Management from 1985 to 1999. There, he developed comprehensive economic forecasts and interpreted economic data for equity and fixed income portfolio managers. Also at Chancellor, Mr. Moeller worked as an equity analyst and was responsible for researching and rating companies in the economically sensitive automobile and housing industries for investment in Chancellor’s equity portfolio. Prior to joining Chancellor, Mr. Moeller was an Economist at Citibank from 1979 to 1984. He also analyzed pricing behavior in the metals industry for the Council on Wage and Price Stability in Washington, D.C. In 1999, Mr. Moeller received the award for most accurate forecast from the Forecasters' Club of New York. From 1990 to 1992 he was President of the New York Association for Business Economists. Mr. Moeller earned an M.B.A. in Finance from Fordham University, where he graduated in 1987. He holds a Bachelor of Arts in Economics from George Washington University.
More Economy in Brief


